


- Crypto news reporter tweets crypto community to unfriend those who say SHIB will hit $1.
- The crypto community expresses mixed opinions to Whalechart’s tweet.
- SHIB makes higher-lows but not higher-highs as sellers nullify the buying pressure.
Crypto and finance news reporting website, Whalechart.org, tweeted the crypto community to cut off ties with friends who keep saying that SHIB would hit $1. Moreover, the tweet advised the community to find new friends, if the preceding statement about their friends was true.
Although, it is not clear as to whether the news platform made the aforementioned statement with an optimistic view that SHIB would surge past $1 or not, the crypto community had varying views.
One crypto enthusiast who took a dig at whalechart.org, tweeted “💯 it’s going to zero way before $1” Contrastingly, an optimistic crypto netizen tweeted “You’re right, $1 is unrealistic. SHIB will hit $10 next bull run.”
However, when considering the seven day chart below, SHIB has been really struggling in the red zone. SHIB was changing hands at $0.0000121 when the market opened for trading. During the first day of the week Shiba Inu was fluctuating close to its opening market price, at times its crests touched the green zone. Nonetheless, most of the time it was receding in the red zone.
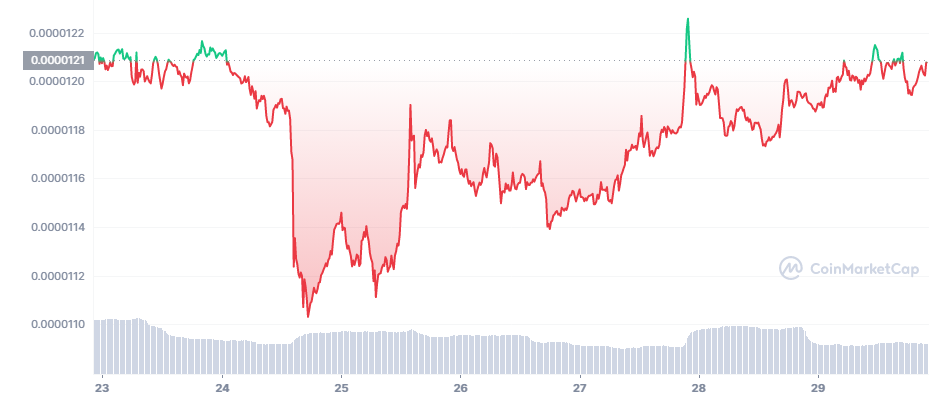
On the second day of the week, Shiba Inu took a great fall. It fell from $0.0000119 to $0.0000110 reaching its lowest price for the week. After this fall, the bulls came to SHIB’s rescue. Hence, SHIB started making higher-lows in the red zone. However, the bulls could only bring Shiba Inu to the surface of the red zone. Although at times the bulls helped SHIB to fluctuate above the opening market price, the bears were too strong and the SHIB tanked back.
Considering the chart below, SHIB was rising exponentially in a parabolic curve from early January to mid January. But, during the second half of January, SHIB wasn’t able to continue its exponential rise, hence it took the form of a linear curve.
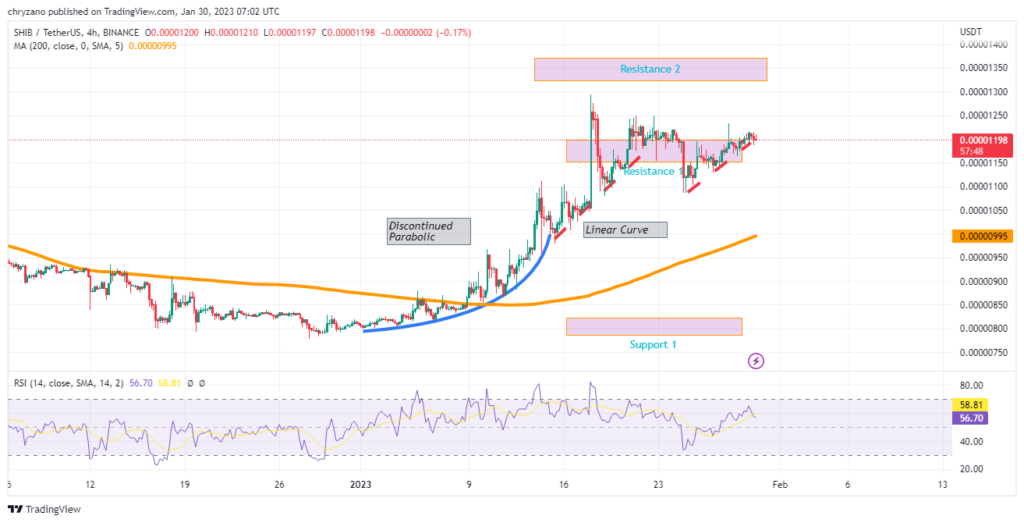
When scrutinizing the rise in the parabolic curve and linear curve, SHIB was making many higher-lows but it wasn’t able to make as many higher-highers. This was because the buying-pressure was canceled out by the selling-pressure as shown in the chart below. Even the few higher-highs it made was due to the buying-pressure exceeding.
Currently, SHIB is surging in a linear curve making higher-lows. However, its price has been moving in a narrow range, and it has made fewer higher-highs than in the past. Hence, the scenario doesn’t look good for day traders as there seems to be very less vertical movement within a day.
Therefore to make up for this meager profits, day traders might need to look at the volume when entering and exiting. Those that take a long position may have to wait a little longer for SHIB to increase if it fails to hit further highs.
Disclaimer: The views and opinions, as well as all the information shared in this price analysis, are published in good faith. Readers must do their own research and due diligence. Any action taken by the reader is strictly at their own risk, Coin Edition and its affiliates will not be held liable for any direct or indirect damage or loss.
Disclaimer: The information presented in this article is for informational and educational purposes only. The article does not constitute financial advice or advice of any kind. Coin Edition is not responsible for any losses incurred as a result of the utilization of content, products, or services mentioned. Readers are advised to exercise caution before taking any action related to the company.
 Price Prediction 2026, 2027, 2028, 2029, 2030-2050")


