


- UNI faces a bearish trend amid declining market cap and trading volume.
- Keltner Channel Bands and RSI suggest potential downside risk for UNI.
- Technical Ratings and Fisher Transform indicate a strong sell signal for UNI.
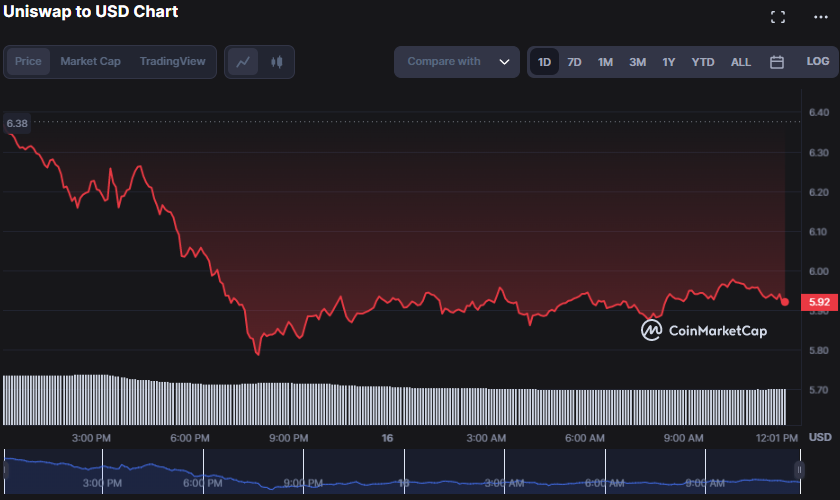
The bears have had the upper hand in the Uniswap (UNI) market since the market commenced the day under negative impact. During this market downturn, bears could lower the price from a 24-hour high of $6.38 to an intraday low of $6.38. When writing, UNI was priced at $5.93, a 6.98% drop from its 24-hour high, showing a pessimistic market mood.
This decline was followed by a drop in market capitalization and 24-hour trading volume of 7.07% and 28.12%, respectively, to $4,510,823,894 and $110,722,740, demonstrating traders’ lack of trust in the token’s short-term performance.
But, market changes are typical, and UNI’s long-term potential remains good as long as the support stays in place.
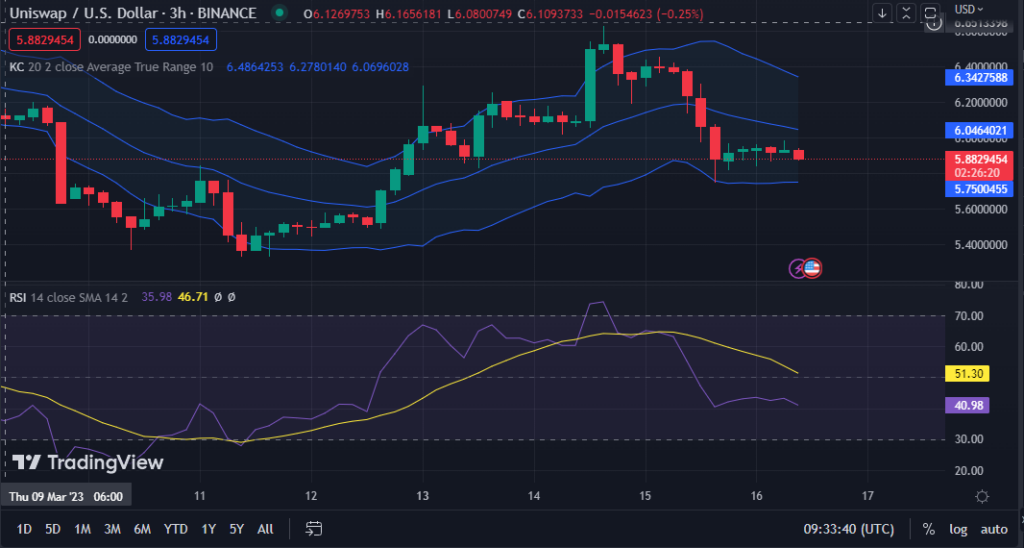
The movement of the Keltner Channel Bands southward, with the upper band at 6.3422969 and the lower bar at 5.7490718, indicates that the UNI market is in a negative trend. This move cautions traders to consider selling their UNI holdings to prevent significant losses.
The price action developing a red candlestick as it advances towards the lower band supports this move, showing that selling pressure is rising and the trend may continue soon, indicating a negative view for UNI.
With a reading of 40.84, the Relative Strength Index (RSI) has executed a bearish crossing, going below its signal line. This move reinforces the market’s pessimistic mood and signals that there may be further downside potential in the short future. If the RSI goes into the oversold zone, “below 30,” it may suggest that the asset is significantly oversold and a possible comeback is coming.
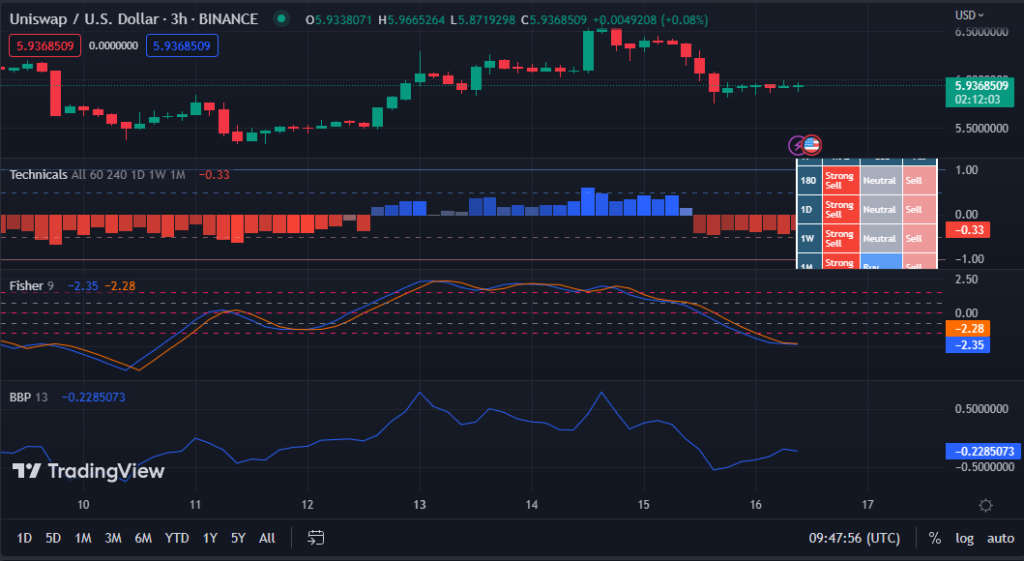
The negative trend is expected to continue in the immediate term, as the Technical Ratings indicator on the UNI 3-hour price chart exhibits a “strong sell” signal. This action warns traders to consider shorting the asset or waiting for a possible rebound before opening an extended position.
The Fisher Transform goes below its signal line value of -2.44 and points downward, adding to the bearish emotion. This movement indicates that the money inflow during the current negative momentum is reducing, and the selling pressure is increasing, suggesting that the price of UNI might fall further.
With a reading of -0.2497159, the Bull Bear Power (BBP) line has moved into negative territory, indicating that the bears are gaining market control. It may be a good opportunity for traders to consider selling positions or wait for a better entry point.
UNI’s short-term outlook is bearish, but its long-term potential remains strong with steady support. Traders should consider selling or waiting for a rebound.
Disclaimer: The views, opinions, and information shared in this price prediction are published in good faith. Readers must do their research and due diligence. Any action taken by the reader is strictly at their own risk. Coin Edition and its affiliates will not be liable for direct or indirect damage or loss.
Disclaimer: The information presented in this article is for informational and educational purposes only. The article does not constitute financial advice or advice of any kind. Coin Edition is not responsible for any losses incurred as a result of the utilization of content, products, or services mentioned. Readers are advised to exercise caution before taking any action related to the company.


