


- VeChain (VET) faces bearish pressure, declining by 1.94% in the last 24 hours.
- Analysts project VET’s potential surge, eyeing $1.8 by October 2024.
- Fibonacci retracement levels signal key milestones for VET’s price trajectory.
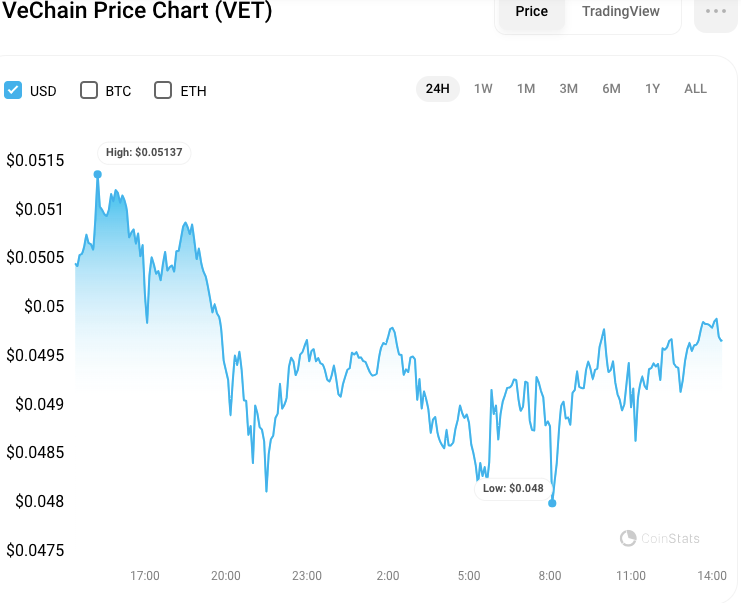
As the cryptocurrency market continues to evolve, VeChain (VET) has emerged as a notable contender, capturing the attention of investors and analysts. Recent analysis suggests a promising future for VET, characterised by a potential surge and strategic price targets. However, bearish sentiment has prevailed in the last 24 hours over the VET market after failing to breach the intra-day high of $0.05137. At press time, VET was trading at $0.04952, a 1.94% decline from the day’s high.
VeChain’s Potential Surge
A forecast by EGRAG CRYPTO suggests an upward trajectory for VET, with a potential price peak at $1.8 by October 2024. This prediction stems from a detailed analysis of VeChain’s current market positioning within a descending channel—a scenario typically associated with bearish trends.
However, EGRAG CRYPTO interprets this pattern as bullish for VET, highlighting the significance of surpassing the 0.5 Fibonacci retracement level at $0.062. A successful breach of this threshold is deemed crucial for cementing the bullish outlook.
Moreover, the analysis anticipates potential pullbacks in VET’s price journey towards its target. Such retracements are viewed not as setbacks but as opportunities for investors to engage with the market strategically. The cyclical peak of VET is projected to align with the 1.618 Fibonacci retracement level within the descending channel by October 2024, reinforcing the $1.8 price target.
VET/USD Technical Analysis
On the VET/USD 24-hour price chart, the Aroon up (orange) moves above the Aroon down (blue), with the former and latter touching at 57.14 and 0.0, respectively. This trend indicates a potential bullish trend reversal, as the Aroon up line crossing above the Aroon down line suggests increasing upward momentum in the VET/USD pair. If the Aroon up line continues to rise and stays above the Aroon down line, it could signal a sustained uptrend.
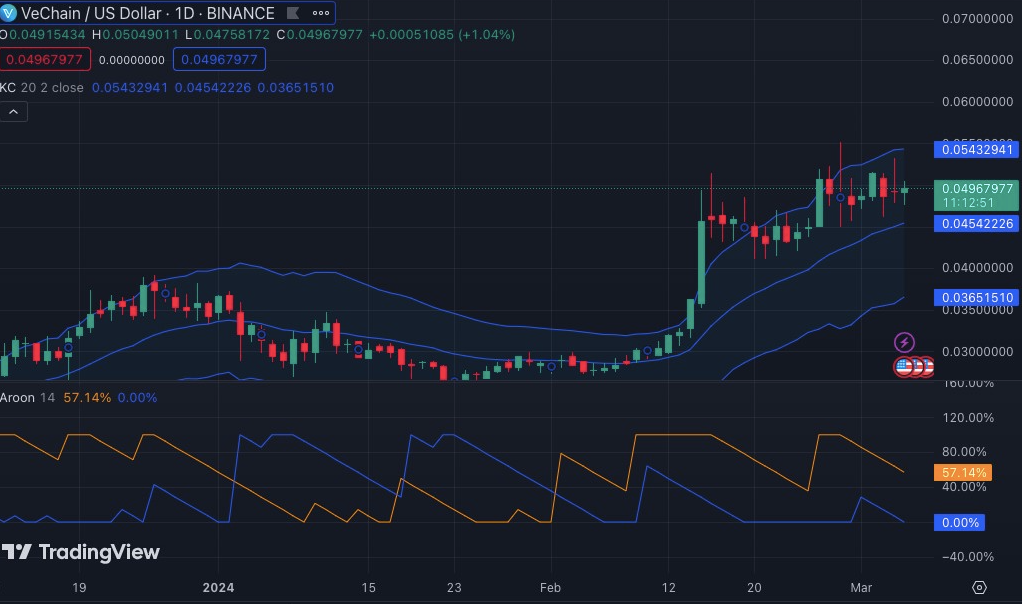
In addition, the Keltner Channel moves upwards, with the upper, middle, and lower bands touching at 0.05432, 0.0454, and 0.03651, respectively. This trend suggests that the VET/USD pair may experience increased volatility in the short term as the price approaches the upper band of the Keltner Channel.
If the bulls manage to break through the upper band, it could indicate strong bullish momentum in the market. However, with the red candlesticks developing after touching the upper band, there may be some resistance at this level that could lead to a temporary pullback in price.
Disclaimer: The information presented in this article is for informational and educational purposes only. The article does not constitute financial advice or advice of any kind. Coin Edition is not responsible for any losses incurred as a result of the utilization of content, products, or services mentioned. Readers are advised to exercise caution before taking any action related to the company.
 Price Prediction 2026, 2027, 2028, 2029, 2030-2050")


 Price Prediction 2026-2030: Will TRX Hit $0.50 Soon?")
 Price Prediction 2026-2050: Will HYPE Hit $100 Soon?")