


 Price Prediction: Will WAVES Price Hit $10 Soon?")
- Bullish WAVES price prediction ranges from $0.70 to $3.
- Analysis suggests that the WAVES price might reach above $2.975.
- The WAVES bearish market price prediction for 2023 is $0.799.
Waves is a community-driven stack of decentralized open-source technology for creating scalable, user-friendly applications. Waves cryptocurrency is a proof-of-stake blockchain network, decentralized exchange, and wallet that enables users to generate their own coins and exchange and trade cryptocurrencies effortlessly. The Waves protocol also supports smart contracts.
If you are interested in the future of WAVES and want to know its predicted value for 2023, 2024, 2025, and 2030, keep reading!
Table of contents
- Waves (WAVES) Market Overview
- What is Waves (WAVES)?
- WAVES Current Market Status
- WAVES Price Analysis 2023
- WAVES Price Prediction 2023-2030 Overview
- WAVES Price Prediction 2023
- WAVES Price Prediction 2024
- WAVES Price Prediction 2025
- WAVES Price Prediction 2026
- WAVES Price Prediction 2027
- WAVES Price Prediction 2028
- WAVES Price Prediction 2029
- WAVES Price Prediction 2030
- WAVES Price Prediction 2040
- WAVES Price Prediction 2050
- Conclusion
- FAQ
- More Crypto Price Predictions:
Waves (WAVES) Market Overview
| 🪙 Name | Waves |
| 💱 Symbol | WAVES |
| 🏅 Rank | #534 |
| 💲 Price | $0.25061459057219 |
| 📊 Price Change (1h) | 0.19 % |
| 📊 Price Change (24h) | -0.6 % |
| 📊 Price Change (7d) | -5.19 % |
| 💵 Market Cap | $33227640.257469 |
| 💸 Circulating Supply | 132584620 WAVES |
| 💰 Total Supply | 132584620 WAVES |
Waves (WAVES) is currently trading at $0.25061459057219 and sits at number #534 on CoinMarketCap in terms of market capitalization. There are 132584620 WAVES coins currently in circulation, bringing the total market cap to $33227640.257469.
Over the past 24 hours, Waves has decreased by 0.6%. Looking at the last week, the coin is down by 5.19%.
What is Waves (WAVES)?
Waves is a global open-source platform for decentralized applications that runs on a proof-of-stake consensus algorithm called WavesNG. Waves technology stack has been built to benefit in any use cases that demand security and decentralization. Be it in open finance, personal identification, gaming, or sensitive data, Waves is built resilient.
Launched in June 2016 following one of the cryptocurrency industry’s earliest initial coin offerings (ICO), Waves initially set out to improve the first blockchain platforms by increasing speed, utility, and user-friendliness.
As an entity endeavoring to appeal to prospective business clients looking to use blockchain to improve processes or create new services, Waves developed products including Gravity, a cross-chain and oracle network, and the decentralized finance (DeFi) focused platform Neutrino.
Furthermore, Waves supported smart contract and DApp development, ensuring that speeds and ease of use surpassed the competition at the time.
Waves DEX is a decentralized cryptocurrency exchange. In 2020, Waves announced that its platform would be interoperable with the Ethereum network by releasing the WAVES token as an ERC-20 standard asset.
Waves’ native token is WAVES, an uncapped supply token used for standard payments such as block rewards.
WAVES Current Market Status
WAVES has a circulating supply of 111,521,152 WAVES coins, while its maximum supply is not available, according to CoinMarketCap. At the time of writing, WAVES is trading at $1.79 representing 24 hours decrease of 0.52%. The trading volume of WAVES in the past 24 hours is $35,135,242 which represents a 2.05% increase.
Some top cryptocurrency exchanges for trading WAVES are Binance, OKX, Deepcoin, Bitrue, and Bybit.
Now that you know WAVES and its current market status, we shall discuss the price analysis of WAVES for 2023.
WAVES Price Analysis 2023
Currently, WAVES ranks 149 on CoinMarketCap. Will WAVES’s most recent improvements, additions, and modifications help its price go up? First, let’s focus on the charts in this article’s WAVES price forecast.
WAVES Price Analysis – Bollinger Bands
The Bollinger bands are a type of price envelope developed by John Bollinger. It gives a range with an upper and lower limit for the price to fluctuate. The Bollinger bands work on the principle of standard deviation and period (time).
The upper band as shown in the chart is calculated by adding two times the standard deviation to the Simple Moving Average while the lower band is calculated by subtracting two times the standard deviation from the Simple Moving Average. When the bands widen, it shows there’s going to be more volatility and when they contract, there is less volatility.
When Bollinger bands are used in a cryptocurrency chart, we could expect the price of the cryptocurrency to reside within the upper and lower bounds of the Bollinger bands 95% of the time. The above thesis is derived from an Empirical law.
The sections highlighted by red rectangles in the chart above show how the bands expand and contract. When the bands widen, we could expect more volatility, and when the bands contract, it denotes less volatility.
The green rectangle shows how WAVES retraced after touching the upper band (overbought). When considering the bandwidth we could see that the bands expanded a large margin. Moreover, the Bandwidth indicator states the value 0.87.
However, after this expansion, the Bollinger band’s expansions and contractions have been very little. As such the prices of WAVES has been moving within a constricted range. Nonetheless, there seems to be some hope arising on the horizon for WAVES.
It comes in the form of the bandwidth indicator (BBW) denoting that the BBW value at 0.27. This place at 0.27 is quite a popular spot for the indicator to rebound and start rising. If this happens then we may see the bands widen and there could be more volatility in the market in the coming days. As such, traders may need to keep a vigilant eye to enter the market in the nick of time.
WAVES Price Analysis – Relative Strength Index
The Relative Strength Index is an indicator that is used to find out whether the price of a security is overvalued or undervalued. As per its name, RSI indicators help determine how the security is doing at present, relative to its previous price.
Moreover, it has a signal line which is a Simple Moving Average (SMA) that acts as a yardstick or reference to the RSI line. Hence, whenever the RSI line is above the SMA, it is considered bullish; if it’s below the SMA, it is bearish.
When considering the first green rectangle from the left of the chart below we can see that the RSI is above the signal. Hence, WAVES is bullish and as a result, it is making higher highs.
The second green rectangle shows that the RSI line (purple) is below the Signal line (yellow). As such, WAVES is bearish or losing value. Therefore it is reaching lower lows as shown in the chart.
Moreover, the RSI could also be used to find out the divergence. For instance, when the token is making higher highs then the RSI should also be making higher highs in unison with it for it to be called a bull run. However, if the RSI does not make higher highs with the token, then we could say that there could be a trend reversal, as the token is losing value despite making higher highs.
Currently, the RSI of WAVES is at 49.93. We could call the trend strong as it is neither overbought nor oversold. Moreover, when taking the RSI Support and Resistance indicator into consideration we could see that WAVES has fallen out of the bull zone and is heading towards the cross-bear zone Grey line). If it breaks the grey line, it may land on the white crossed line (Crossover oversold). However, the chances of the preceding happening are slim since WAVES has been rebounding off of the grey line lately. As such it may reciprocate this behavior.
Traders looking to go long may want to place their entry point at $1.677 and keep their stop loss close to 1.5 while the take profit could be close to the green line above.
Meanwhile, Stochastic RSI is heading into the normal range after being overbought for quite some time. As such the Stochastic RSI may continue going down.
However, on a previous occasion in September 2022, when the Stochastic RSI was just crossing the overbought zone and entering the normal zone, we could see that the Stochastic RSI rebounded off it and started ascending. It may reciprocate this behavior once again.
WAVES Price Analysis – Moving Average
The Exponential Moving averages are quite similar to the simple moving averages (SMA). However, the SMA equally distributes down all values whereas the Exponential Moving Average gives more weightage to the current prices. Since SMA undermines the weightage of the present price, the EMA is used in price movements.
The 200-day MA is considered to be the long-term moving average while the 50-day MA is considered the short-term moving average in trading. Based on how these two lines behave, the strength of the cryptocurrency or the trend can be determined on average.
In particular, when the short-term moving average (50-day MA) approaches the long-term moving average (200-day MA) from below and crosses it, we call it a Golden Cross.
Contrastingly, when the short-term moving average crosses the long-term moving average from above then, a death cross occurs.
Usually, when a Golden Cross occurs, the prices of the cryptocurrency will shoot up drastically, but when there’s a Death Cross, the prices will crash.
Whenever the price of cryptocurrency is above the 50-day or 200-day MA, or above both we may say that the token is bullish (Red rectangle). Contrastingly, if the token is below the 50-day or 200-day, or below both, then we could call it bearish (Blue triangle section).
Currently, it seems that the bears have taken over the market. This could be proved as both the moving averages are sloping downwards. Notably, the 50-day MA was recovering and rising towards the 200-day MA which was above it from the beginning of 2023.
However, the rise of the 50-day MA was disturbed at the beginning of March. We could see the 50-day MA slant downwards and move parallel to the 200-day MA. Currently, WAVES has been rejected after testing the 50-day MA. As such it may sort for support at $1.522.
Moreover, we could expect WAVES to rebound off of the above-mentioned support and test the 50-day MA. As such, traders may need to consider having their entry point close to the above-mentioned support level.
WAVES Price Analysis – Elder Force Index
Elder Force Index is an indicator that was invented by Alexander Elder, who was an entrepreneur. The indicator mainly uses two parameters to adjudicate the buying and selling force and thereby predicts the market trend. In particular, it relies on price change and volume. As such the strength of the buying force or selling force is dependent on either the price change or the volume.
Whenever the EFI is greater than zero, or positive, we could say that the trend is bullish, as there is more buying pressure. However, when the EFI is in the negative zone, we could say that the cryptocurrency is in the negative zone and the selling pressure is more.
Moreover, the Elder Force could also be used to figure out trend reversals and breakouts. For instance when the EFI is making lower highs while the cryptocurrency is making higher highs, then we could say that this is a bearish divergence, as shown in the chart. However, in the event that the cryptocurrency is making lower lows while the EFI is making higher lows, then it is a bullish divergence represented in the chart.
Currently, the Elder Force Index(EFI) line which is at 212.77K is heading towards the zero line. However, previously on an occasion, when the EFI was crashing just like this, the bull’s pressure made the line rebound off of 154.31K. We could expect the bulls to chip in once the EFI reaches close to the above-mentioned figure. Moreover, to strengthen this thesis, the Bear-Bull Power indicator also shows that its line which was sloping down has recovered and is now moving parallel to the horizontal.
Since the bulls power is increasing we may see more buyers join the bandwagon. And when more buyers join the buying frenzy, we may witness the price of WAVES going up by a large margin while the volume too will increase. As such we could expect the EFI to rise.
WAVES Price Prediction 2023-2030 Overview
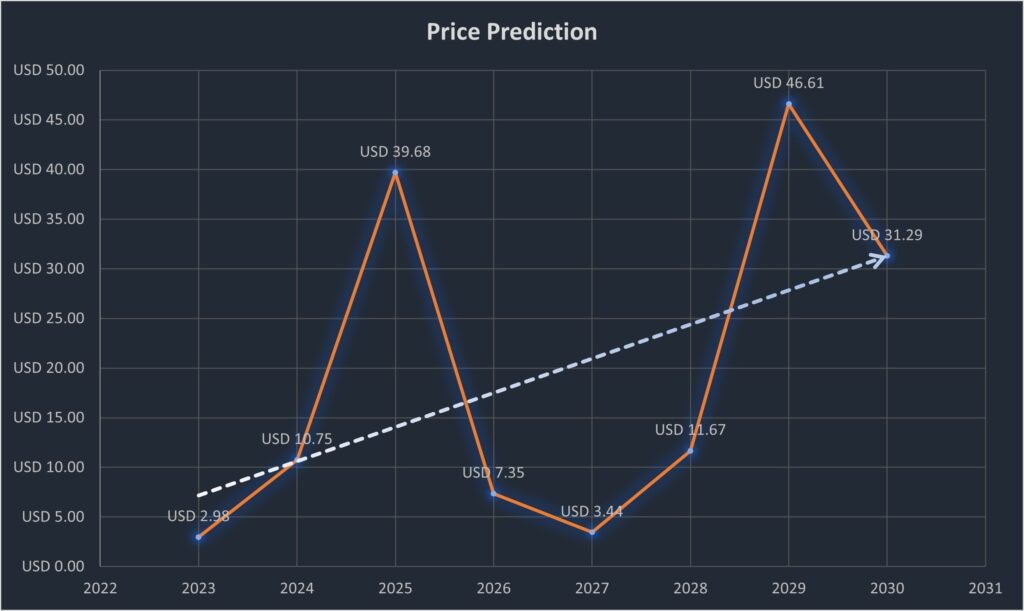
| Year | Minimum Price | Average Price | Maximum Price |
| 2023 | $1.291 | $2.975 | $3.526 |
| 2024 | $8.795 | $10.746 | $12.451 |
| 2025 | $37.982 | $39.683 | $42.198 |
| 2026 | $6.584 | $7.352 | $8.914 |
| 2027 | $2.921 | $3.444 | $5.645 |
| 2028 | $10.2854 | $11.668 | $13.521 |
| 2029 | $42.125 | $46.613 | $48.982 |
| 2030 | $28.758 | $31.2857 | $34.265 |
| 2040 | $55.6521 | $58.5894 | $62.351 |
| 2050 | $80.2651 | $85.7844 | $89.9815 |
WAVES Price Prediction 2023
When considering the chart above, we could see that WAVES is trading inside the falling wedge since February. It has been descending from Resistance 3 at ≈$3.00 and right now it has rebounded after receiving support at Support 1 ($1.50). Since WAVES has been stringently following the trend lines we could expect WAVES to rebound off of both trend lines before breaking out.
In particular, now that WAVES is moving close to the upper trend line, the chances of it rebounding off of it are high since the Upper Bollinger band also intersects with the upper trend line here.
Once WAVES completes forming the falling wedge pattern it may break out. However, there is also the possibility of WAVES breaking out before completing forming the pattern.
Traders may want to follow WAVES closely and do their due diligence before entering the market. As such, those hoping to go long may want to wait for WAVES to breakout out of the wedge and set the entry point just above the upper trend line while having their stop loss at the latest lowest.
When it comes to setting the take profit, those going long may want to have it at Resistance 2 ($2.975). The thesis to WAVES reaching Resistance could be derived from its previous hike from this very price. Additionally, as per the book, we could expect WAVES to increase by the height of the wedge at its early stage. Moreover, when the height of the wedge is placed at the upper trend line as shown in the chart, it reaches Resistance 2.
However, on its way to Resistance 2, it may face some friction at Resistance 1 ($2.453). Hence, we could expect some rebound off of Resistance 1. For those who missed out on entering the market at the breakout, these rebounds off of Resistance 1 may present an excellent entry point. All the above predictions are valid given that WAVES is held up by Support 1 at $1.492. Nonetheless, in the unlikely event that Whales enter the market and disrupt WAVES movements with a dump, we may expect WAVES to crash below Support 1 and reach Support 2 at $0.799.
WAVES Price Prediction – Resistance and Support Levels
When considering the chart we could note that WAVES was heavily dependent on the 3:1 Gann line for support from October 2020 to late 2021 while it tested and broke the 2:1 Gann line on numerous occasions. However, during the aforementioned time frame, WAVES also did seek support from the 4:1 Gann line a few times.
Nonetheless, the more important aspect to notice about the WAVES movement is its brief rise above the 1:1 Gann line. Specifically, in May 2021, it rose above the 1:1 Gann line briefly which is considered bullish. However, shortly after this WAVES fell back to the 3:1 Gann line for support.
After October 21, WAVES upward rise was barred by the 2:1 Gann line. Being rejected by the 2:1 Gann line, WAVES did not receive support at the 3:1, or 4:1 Gann lines. However, the 8:1 Gann line was able to rescue WAVES from its further fall. After receiving support at 8:1, WAVES rose vertically and reached its all-time high of $63. However, this too was short-lived, as WAVES crashed vertically and did not find support at the 8:1 Gann line. Hence it is presently trading below the 8:1 Gann line.
In the event that WAVES receives support from the 8:1 Gann line, we could expect it to reach the 3:1 Gann line and rise along it.
WAVES Price Prediction 2024
There will be Bitcoin halving in 2024, and hence we should expect a positive trend in the market due to user sentiments and the quest by investors to accumulate more of the coin. However, the year of BTC halving didn’t yield the maximum WAVES based on the previous halving. Hence, we could expect WAVES to trade at a price not below $10.746 by the end of 2024.
WAVES Price Prediction 2025
WAVES may experience the after-effects of the Bitcoin halving and is expected to trade much higher than its 2024 price. Many trade analysts speculate that BTC halving could create a huge impact on the crypto market. Moreover, similar to many altcoins, WAVES will continue to rise in 2025 forming new resistance levels. It is expected that WAVES would trade beyond the $39.683 level.
WAVES Price Prediction 2026
It is expected that after a long period of bull run, the bears would come into power and start negatively impacting the cryptocurrencies. During this bearish sentiment, WAVES could tumble into its support regions. During this period of price correction, WAVES could lose momentum and be way below its 2025 price. As such it could be trading at $7.352 by 2026.
WAVES Price Prediction 2027
Naturally, traders expect a bullish market sentiment after the crypto industry was affected negatively by the bears’ claw. Moreover, the build-up to the next Bitcoin halving in 2028 could evoke excitement in traders. However, there will be a dip before WAVES actually surges, as such we could expect WAVES to trade at around $3.444 by the end of 2027.
WAVES Price Prediction 2028
As the crypto community’s hope will be re-ignited looking forward to Bitcoin halving like many altcoins, WAVES may reciprocate its past behavior during the BTC halving. Hence, WAVES would be trading at $11.668 after experiencing a considerable surge by the end of 2028.
WAVES Price Prediction 2029
2029 is expected to be another bull run due to the aftermath of the BTC halving. However, traders speculate that the crypto market would gradually become stable by this year. In tandem with the stable market sentiment, WAVES could be trading at $46.613 by the end of 2029.
WAVES Price Prediction 2030
After witnessing a bullish run in the market, WAVES and many altcoins would show signs of consolidation and might trade sideways and move downwards for some time while experiencing minor spikes. Therefore, by the end of 2030, WAVES could be trading at $31.285
WAVES Price Prediction 2040
The long-term forecast for WAVES indicates that this altcoin could reach a new all-time high(ATH). This would be one of the key moments as HODLERS may expect to sell some of their tokens at the ATH point.
If they start selling then WAVES could fall in value. It is expected that the average price of WAVES could reach $58.5894 by 2040.
WAVES Price Prediction 2050
The community believes that there will be widespread adoption of cryptocurrencies, which could maintain gradual bullish gains. By the end of 2050, if the bullish momentum is maintained, WAVES could hit $.85.7844
Conclusion
If investors continue showing their interest in WAVES and add these tokens to their portfolio, it could continue to rise. WAVES’s bullish price prediction shows that it could reach the $3 level.
FAQ
Waves is a blockchain platform that supports a variety of use cases, such as decentralized applications (dApps) and smart contracts. With Waves, users can build and launch their own crypto tokens. Waves enable the creation and trading of cryptocurrency tokens without the need for complex, innovative contract programming. Tokens can be created and controlled by scripts run under Waves user accounts.
WAVES tokens can be traded on many exchanges like Binance, OKX, BTCEX, Deepcoin, and Bitrue.
WAVES has a possibility of surpassing its present all-time high (ATH) price of $62.36 in 2022.
WAVES is one of the few cryptocurrencies that has shown resilience. As such, we could expect it to burst out with a large spike. If it does spike after breaking out of the wedge, then, it might reach $3 soon after it breaks the Resistance 1 level.
WAVES has been one of the most suitable investments in the crypto space. It is highly volatile, as such, it has quite a margin when its price fluctuates. Hence, traders may be allured to invest in WAVES. It’s a good investment in the short term and in the long term as well.
The present all-time low price of WAVES is $0.1227.
The maximum supply of WAVES is unavailable.
WAVES was launched in June 2016.
Ukrainian-born scientist Alexander Ivanov (also known as Sasha Ivanov) is the founder of WAVES.
WAVES can be stored in a cold wallet, hot wallet, or exchange wallet.
WAVES is expected to reach $2.975 by 2023.
WAVES is expected to reach $10.746 by 2024.
WAVES is expected to reach $39.683 by 2025.
WAVES is expected to reach $7.352 by 2026.
WAVES is expected to reach $3.444 by 2027.
WAVES is expected to reach $11.668 by 2028.
WAVES is expected to reach $46.613 by 2029.
WAVES is expected to reach $31.285 by 2030.
What will be the WAVES token’s price in 2040?
WAVES is expected to reach $85.7844 by 2050.
Disclaimer: The views and opinions, as well as all the information shared in this price prediction, are published in good faith. Readers must do their research and due diligence. Any action taken by the reader is strictly at their own risk. Coin Edition and affiliates will not be held liable for direct damage or loss.
More Crypto Price Predictions:
- Enjin (ENJ) Price Prediction 2023-2030
- Fantom (FTM) Price Prediction 2023-2030
- Syscoin (SYS) Price Prediction 2023-2030
- The Graph (GRT) Price Prediction 2023-2030
- Basic Attention Token (BAT) Price Prediction 2023-2030
Disclaimer: The information presented in this article is for informational and educational purposes only. The article does not constitute financial advice or advice of any kind. Coin Edition is not responsible for any losses incurred as a result of the utilization of content, products, or services mentioned. Readers are advised to exercise caution before taking any action related to the company.
: What Happens If You Use an Unlicensed Platform?")


