


- The price of Ethereum Classic (ETC) has increased by 0.52% during the last day.
- According to the indicators the price of ETC will keep going up.
- Tired bears watch as bulls manage to drive up the price of ETC.
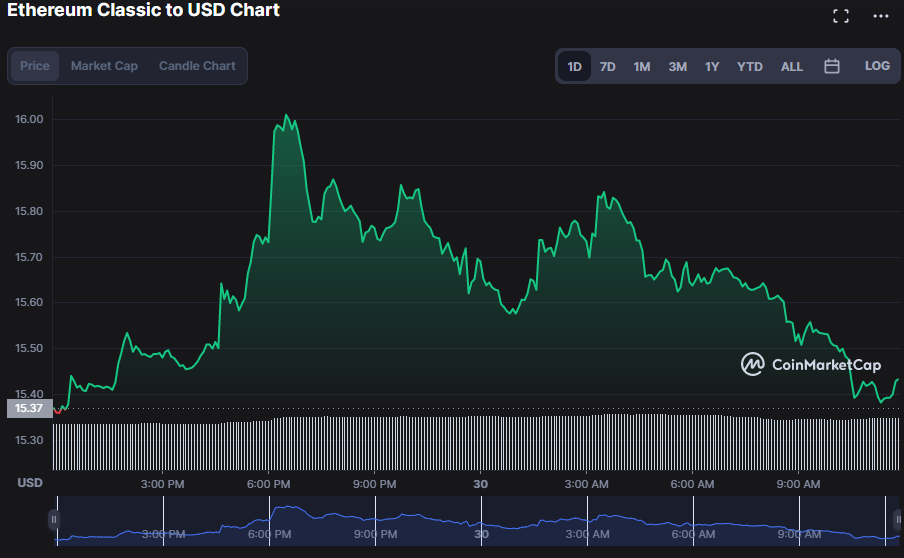
Ethereum Classic (ETC) bulls seem to be picking up the slack, as the day’s low and high ranges are $15.35 and $16.01, respectively. It is up from yesterday’s low and high of $14.92 and $16.01, respectively.
In light of this positive trend, the current price of ETC is $15.44, a 0.52% increase over the last 24 hours. The 24-hour trading volume also surged by 13.06% to $131,773,108 due to this positive trend. The the market cap too improved by 0.61% to $2,142,890,387.
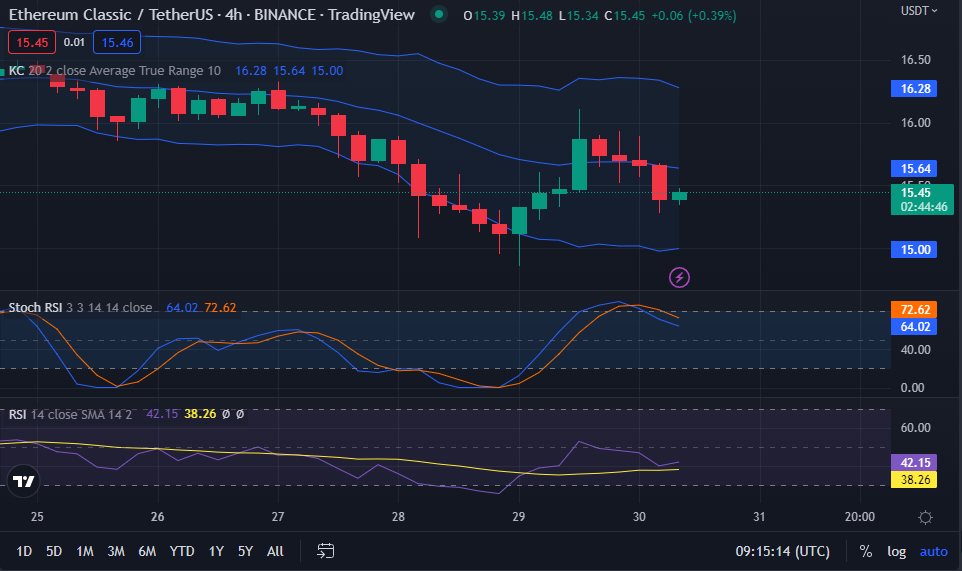
Keltner Channel bands broadening on the 4-hour price chart are an indication of heightened market volatility in the ETC market. The upper and lower bands meet at 16.28 and 15.00, respectively, demonstrating higher volatility. A persistent bullish run may not be envisaged, however, since prices have been moving below the signal line and toward the lower band.
Based on the current Stoch RSI reading of 64.81, it seems that the market’s current uptrend will continue. Given the stoch RSI current downward trend below the signal line, traders should be careful of a potential near-term price reversal.
On the chart of ETC prices, the RSI is now at 42.47, with a bullish trend. The fact that the RSI has been rising and is not yet oversold or overbought indicates that this trend is positive. A higher RSI indicates a greater likelihood of a prolonged bullish run in the ETC market.
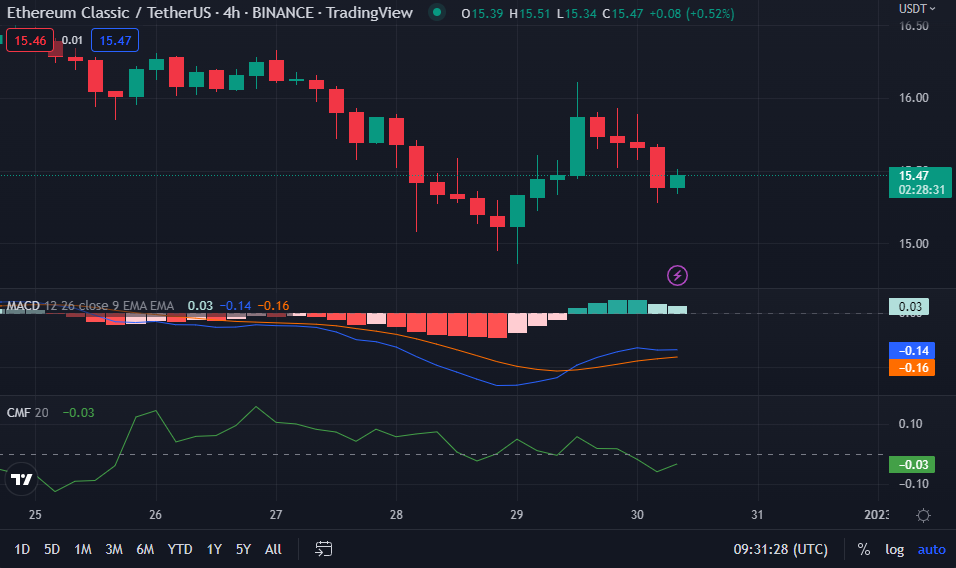
The MACD movement is also negative (-0.13), lending credence to this pessimistic outlook. Bullish momentum is expected to diminish as it moves further into negative territory, but given that it’s still above the signal line and the histogram is ascending, the cheerful outlook should prevail.
The bullish degradation is further supported by the Chaikin Money Flow (CMF), which is also trending negative. This is shown by a value of -0.03, but the fact that it is now heading north in an attempt to cross the “0” line mitigates the otherwise dismal forecast for the ETC market.
If the ETC market’s uptrend is to continue, bulls will need to work to maintain the current resistance level and price levels.
Disclaimer: The views and opinions, as well as all the information shared in this price analysis, are published in good faith. Readers must do their own research and due diligence. Any action taken by the reader is strictly at their own risk, Coin Edition and its affiliates will not be held liable for any direct or indirect damage or loss
Disclaimer: The information presented in this article is for informational and educational purposes only. The article does not constitute financial advice or advice of any kind. Coin Edition is not responsible for any losses incurred as a result of the utilization of content, products, or services mentioned. Readers are advised to exercise caution before taking any action related to the company.


