


- BLUR is trading at its intraday low of $0.4851 after witnessing a downfall of 7.05% in one day.
- Lookonchain noticed a lot of selling activity from whales and institutional investors, totaling 16.5 million BLUR.
- BLUR’s price correction may be moving in falling wedge pattern in an uptrend market.
Waking up to today’s trading floor, analysts and traders have noticed a significant drop in BLUR’s prices. According to CoinMarketCap, BLUR is trading at its intraday low of $0.4851 after witnessing a downfall of 7.05% in one day.
BLUR, valued at $0.4845, continues to move downward while making a brief attempt to escape this bear trap. Furthermore, the 39.40% tumble in BLUR’s trading volume could indicate a shift in investor sentiment and a slowdown in market activity.
Lookonchain, an on-chain market analytical platform, noticed a lot of selling activity from whales and institutional investors, totaling 16.5 million BLUR. Highlighting the selling activity of these whales, the platform reported that a whale deposited the airdropped 2.54 million BLUR to Binance. At the time of reporting, it was estimated that 2.54 million BLUR were valued at $1.26 million.
Moreover, Mandala Capital deposited 2.76 million BLUR to OKX while facing a loss valued at approximately $100,000. Another whale, “0x68b5”, withdrew 3.31 million BLUR from Binance between November 25 and 29. After transferring it to Binance in the last two days, the whale made a loss of approximately $65K.
Five wallets also received BLUR from Coinbase Custody and deposited it into exchanges through Wintermute, with a total of 8.24 million BLUR valued at approximately $4.12 million. These subsequent whale-selling transactions may have caused the bears to overpower the bulls.
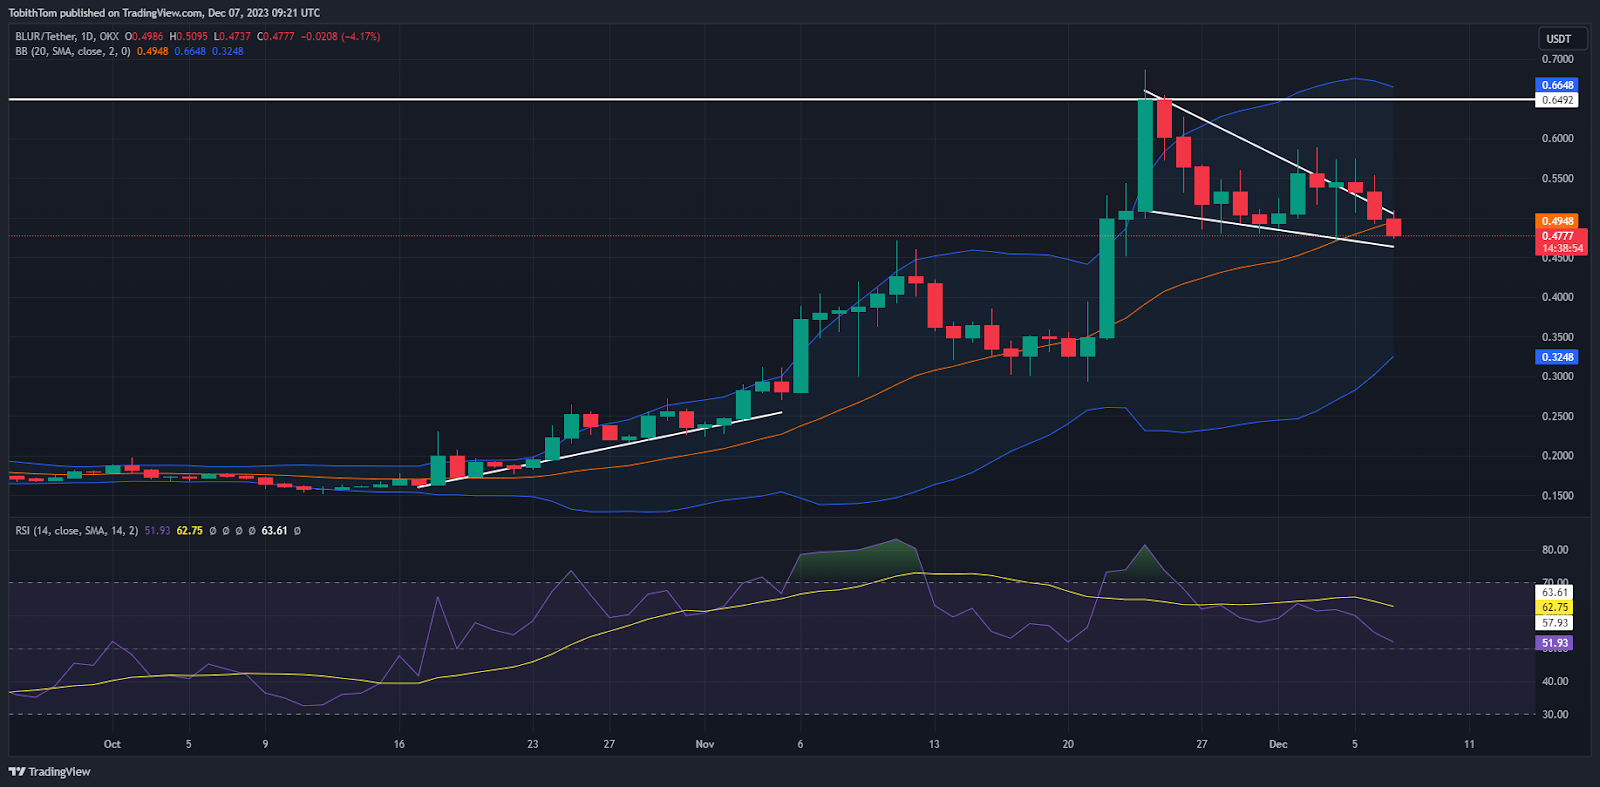
Looking at the chart above, it seems that the candlesticks may be moving in a falling wedge pattern in an uptrend. The large green candlestick and subsequent price correction red candlesticks are two of the most common patterns observed by analysts.
However, it is still too early to confirm whether a falling wedge may happen or whether the breakout will be bullish or bearish. Since the previous uptrend was heavily influenced by buyers, as seen through the RSI indicator, there may be a chance that the candlesticks could continue to fall for some time.
Disclaimer: The information presented in this article is for informational and educational purposes only. The article does not constitute financial advice or advice of any kind. Coin Edition is not responsible for any losses incurred as a result of the utilization of content, products, or services mentioned. Readers are advised to exercise caution before taking any action related to the company.


