


- Bulls must push through resistance to achieve fresh highs.
- AGIX bulls persistently battle and negate the bear hold in the market.
- Indicators hint at more price increases in the near future if bulls defend the resistance level.
SingularityNET (AGIX) has lately restored positive momentum after being controlled by bears in the preceding hours. The bear domain had dragged the AGIX price down to a low of $0.1753, where it found support. As of press time, the bulls had regained control of the market, propelling the price up to $0.2057, a 3.76% gain.
With a 3.96% growth in market capitalization to $241,608,668 and a 30.56% decline in 24-hour trading volume to $123,812,714 on the AGIX market, a positive trend is believed to be on the rise as traders’ excitement grows in the AGIX market. Despite the positive bullish trend, the drop in trading volume suggests that traders are reluctant to trade and join the market.
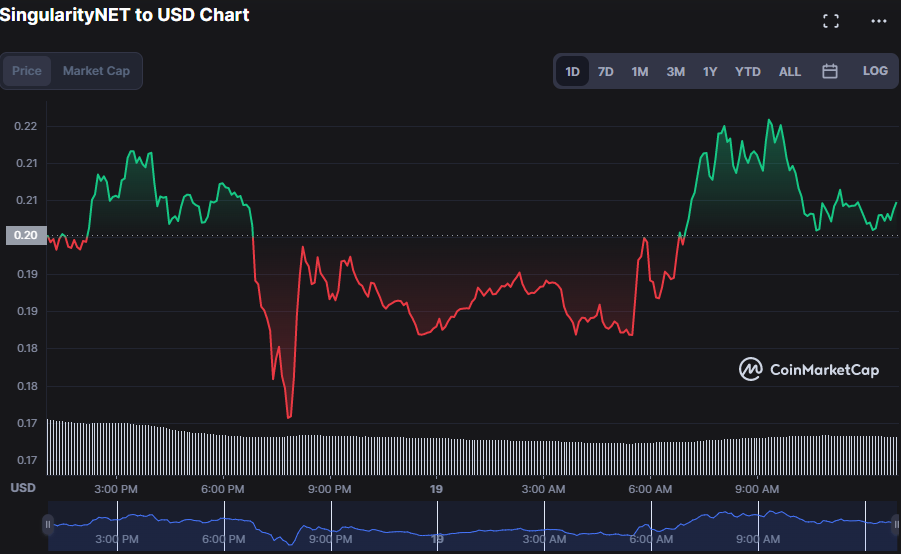
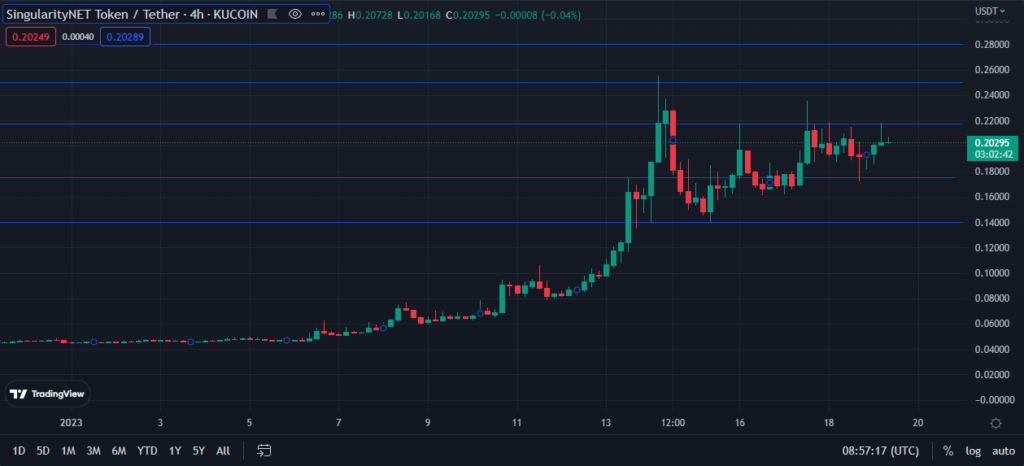
In the previous 24 hours, the AGIX market price has ranged between $0.1753 and $0.217. If the bullish trend continues, the price may break through the resistance level, establishing a new support level. For investors, this is a potentially profitable opportunity since the price of AGIX might skyrocket if it breaks through the current barrier level. If this pattern holds, the next resistance levels might be $0.25 and $0.28, providing investors with an even bigger opportunity to profit.
However, if this resistance level of $0.217 is not broken and bears grab market dominance, the price of AGIX might go as low as $0.17 and below, offering a chance to profit at a cheaper entry point.
If bears take market dominance, the next support levels might be $0.17 and $0.14, providing investors with the opportunity to benefit in the near term by carefully positioning buy and sell orders.
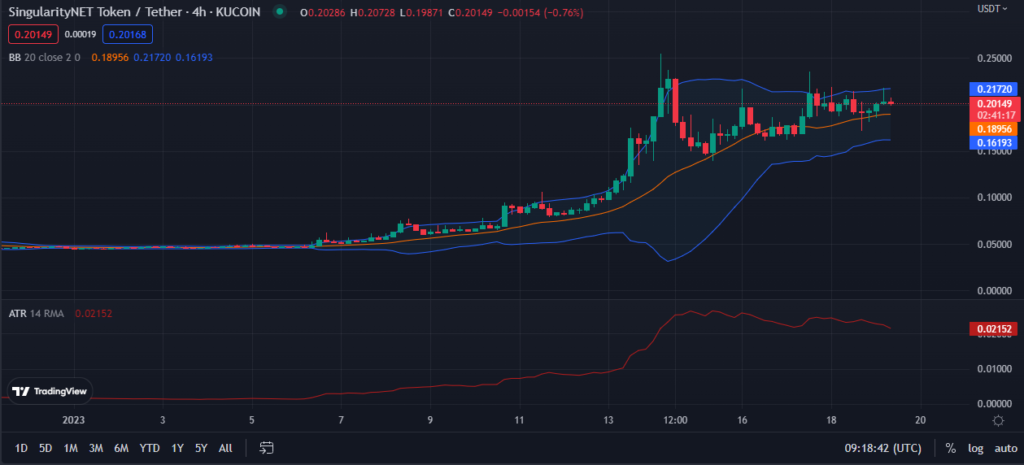
The ascending Bollinger Bands on the 4-hour price chart, with the upper band at $0.21718 and the lower band at $0.16913, indicate that the price of AGIX will be volatile in the near future. This movement enhances the possibility of a breakthrough in either direction. However, since the price action is moving toward the upper band, it is more probable that AGIX will break out to the upside.
The ATR reading of 0.02149 on the AGIX price chart indicates that bulls are hoping for higher prices, as it indicates that there is low volatility in the market. This action alerts traders to probable price rises in the future, encouraging additional buyers to enter the market. This increase in purchasers is typically seen as an indication of a robust market, as more merchants band together to jointly push up prices.
As long as buyer confidence in the AGIX market persists, prices are expected to climb further, as indicated by the technical indicators.
Disclaimer: The views and opinions, as well as all the information shared in this price analysis, are published in good faith. Readers must do their own research and due diligence. Any action taken by the reader is strictly at their own risk, Coin Edition and its affiliates will not be held liable for any direct or indirect damage or loss.
Disclaimer: The information presented in this article is for informational and educational purposes only. The article does not constitute financial advice or advice of any kind. Coin Edition is not responsible for any losses incurred as a result of the utilization of content, products, or services mentioned. Readers are advised to exercise caution before taking any action related to the company.


