 NFT Narrative May Help Its Rise to $1.90")
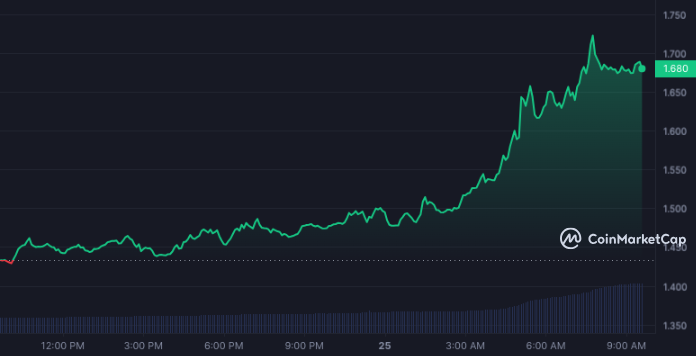
- APE’s price jumped by 17%, with an analyst suggesting a breakout for the token.
- APE retraced to $1.65 but bulls’ presence may help its recovery toward $1.90.
- If the overbought condition leads to a reversal, then an entry could appear around $1.60.
According to crypto analyst Crypto Kaleo, ApeCoin (APE) may soon break out because of the positive narrative growing around cryptocurrencies linked to NFT projects. Kaleo made his opinion known in a post on X (formerly Twitter), noting that the APE could be next to follow the path of Blur (BLUR) and LooksRare (LOOKS).
In the last 24 hours, the price of APE has increased by 17.52%, data from CoinMarketCap revealed.
APE to Reclaim August High?
But compared to the performance of LOOKS and BLUR, ApeCoin still lagged behind. However, Kaloe explained his bias using the APE/BTC chart. From the chart shared, the analyst highlighted that High Time Frame (HTF) has been stuck in a downtrend for most of the year.
He also added that APE would break higher since the cryptocurrency had tested October lows. In turn, ApeCoin had the tendency to surpass the August high which was around $1.90.
“Zooming in $APE/$BTC is currently testing the highs of the October base range which coincides with the HTF resistance from the downtrend mentioned above First target is a move back to the highs of the August range”, Kaloe noted.
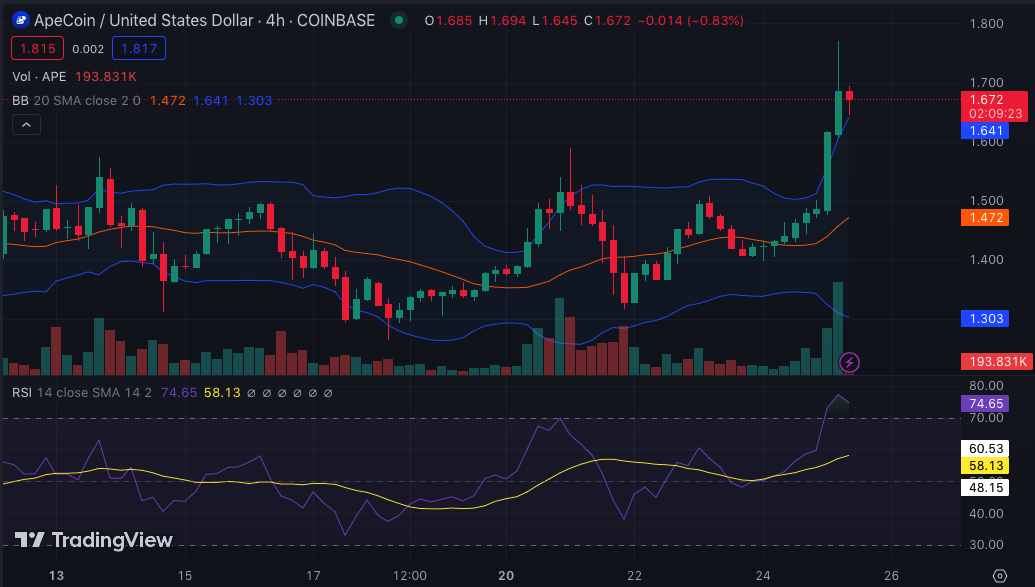
At the time of wrting, APE’s price was $1.65. The APE/USD 4-hour chart revealed that buyers were in total control of the market direction. This bulls’ presence ensured that APE hit $1.69 before a brief retracement to $1.65.
Furthermore, the Bollinger Bands (BB) showed that the volatility around ApeCoin was increasing. The upper band of the BB also tapped APE at $1.63 earlier, indicating the cryptocurrency was overbought.
Typically, the overbought condition is supposed to trigger a drawdown probably below $1.60. But it seems bulls are not allowing that. Also, the Relative Strength Index (RSI) reading was 74.65
Readings of the RSI above 70 imply that a token is overbought just like the BB indicated. But the reading is also a sign that buying pressure is very present. Should the buying pressure continue, the RSI reading may continue to increase.
If this happens, then APE might hit the August high of $1.90. However, traders may need to be careful about opening a long APE position at the current price. If the APE price reverses, then a good entry could be around $1.60.
Disclaimer: The information presented in this article is for informational and educational purposes only. The article does not constitute financial advice or advice of any kind. Coin Edition is not responsible for any losses incurred as a result of the utilization of content, products, or services mentioned. Readers are advised to exercise caution before taking any action related to the company.


