


- OP fell to $3.24 after crossing $4, while ARB dropped to $1.85 before hitting $3.
- A breakdown below $3.15 could send OP trading as low as $2.50.
- The 9 and 20 EMA closed above ARB’s price, suggesting another drawdown.
After reacting positively to the spot ETF approval, L2 tokens Arbitrum (ARB) and Optimism (OP) have lost a significant chunk of their values. In the last seven days, ARB has lost 16.74% of its value. This placed the price at $1.87, despite its initial attempt to test $3.
OP, on the other hand, was not any better, sliding by 15.06% and trading at $3.24 at press time. The price decrease of these tokens could also be linked to Ethereum (ETH). Historically, when ETH rallies, ARB and OP do much better. At press time, ETH’s price had decreased by 5.33% within the same period that OP and ARB fell.
Optimism (OP)
On January 12, OP hit $4.29, marking its highest price since it launched. At that time, the volume around the cryptocurrency surged. However, that parabolic movement has been halted by intense selling, as the 4-hour chart showed that OP had dropped to $3.21.
With a steady decline, OP risked falling from the $3 region. At press time, there was support at $3.15, which served as a crucial zone for the token. A breakdown below the level could send OP sliding to $2.50, which was a notable point of interest.
However, if bulls resist the selling pressure, then OP might sustain its value above $3.20. If this happens, OP could have a slight increase. But there was a notable resistance at $3.51, which could be hard to break.
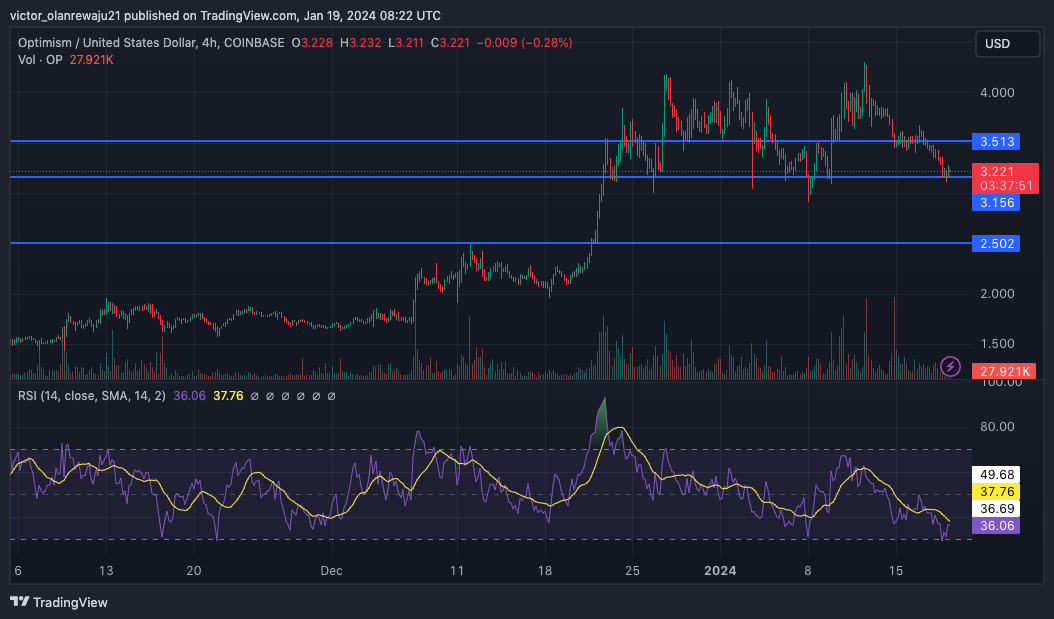
Furthermore, the RSI was down to 36.06, suggesting weakness for the cryptocurrency. Should buying momentum fail to appear, then OP’s short-term recovery might not be an option.
Arbitrum (ARB)
Technical analysis using the 4-hour chart showed that ARB might have tapped a local top at $2.40. Furthermore, it was obvious that there were attempts to keep the price above $2 on January 15 and 17.
But the neckline resistance around the same area ensured that the candlesticks closed below the said price. Coin Edition also looked at the Exponential Moving Average (EMA).
As of this writing, the 9 EMA (blue) was at $1.90, while the 20 EMA (yellow) was at $1.97. This suggests bearish potential.
Also, ARB at $1.85 closed below both EMAs. With this in place, it means buyers do not have enough steam to trigger a recovery.
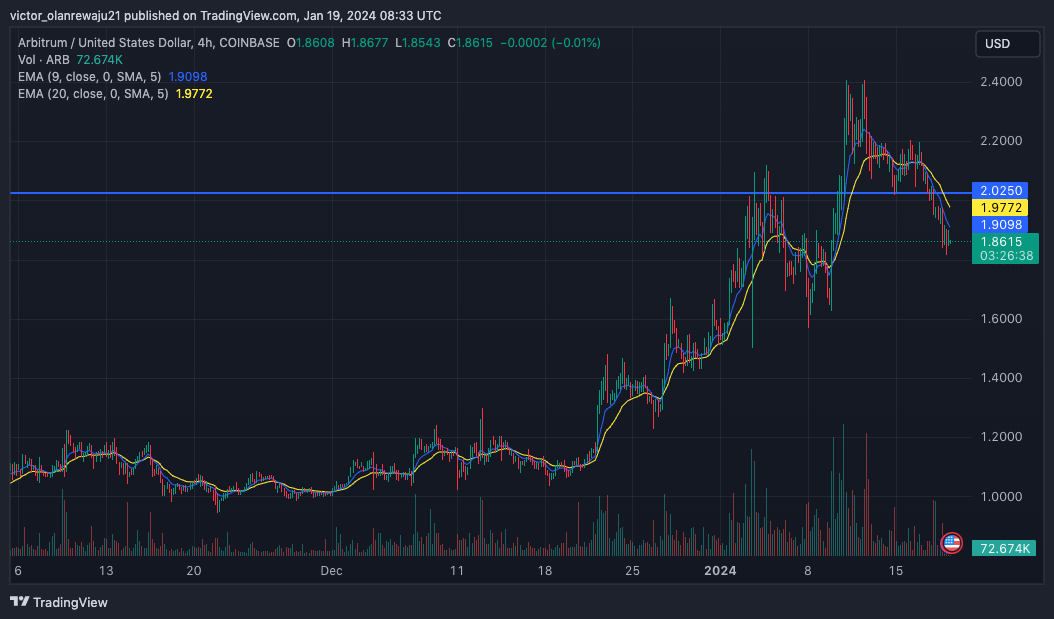
As a result, ARB could drop further. However, traders need to watch out for the price action of ETH. If ETH recovers, then there is a high chance that ARB and OP will follow.
Disclaimer: The information presented in this article is for informational and educational purposes only. The article does not constitute financial advice or advice of any kind. Coin Edition is not responsible for any losses incurred as a result of the utilization of content, products, or services mentioned. Readers are advised to exercise caution before taking any action related to the company.


