- Chainlink upgrades over the years placed it in the 4th position in terms of development activity.
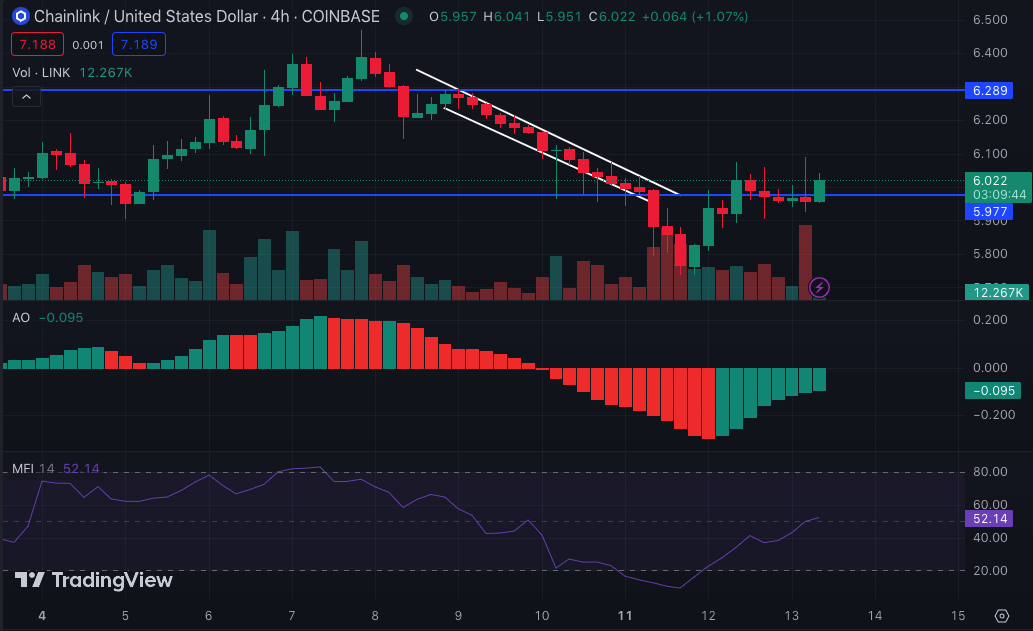
- LINK hit $6 after mild buying pressure from bulls in the market.
- If the MFI and AO continue to form highs, LINK may reach $6.50 soon.
According to on-chain analytic provider Santiment, Chainlink’s (LINK) development activity has been impressive for the last three years. As a result of the increase, Chainlink became the fourth most valuable project in terms of development activity.
Chainlink Gives Polkadot a Run
By definition, development activity in crypto measures the shared GitHub repository connected to a project. In simpler terms, the metric tracks the dedication shown by developers in ensuring that a project’s network works effectively.
Typically, projects like Cardano (ADA) and Polkadot (DOT) top this metric, and the status has not changed.
Chainlink’s rise in position could be linked to some of the upgrades and integrations it has had lately. The likes of Arbitrum (ARB), Optimism (OP), and Coinbase’s L2 Base have had interesting partnerships with Chainlink. Thus, the development activity increase could be termed a well-deserved one.
In terms of LINK’s price action, CoinMarketCap showed that the token value was $6 at press time. For many analysts, the current LINK price means that it is very undervalued, and at $6, LINK is trading at a discount.
LINK’s Time to Recover?
From the 4-hour LINK/USD chart, the token has exited the bearish market structure it dealt with between September 9 and 11. Consequently, mild buying pressure ensured that LINK rose back to $6.
It is also possible that LINK could rise farther than the current price, as indicated by the Awesome Oscillator (AO). At the time of writing, the AO was -0.096. Normally, a positive AO suggests that the 5-period Moving Average (MA) is greater than the 34-period MA. Assuming the AO is positive, it would mean that momentum is incredibly bullish. However, negative values of the AO indicate increasing downward momentum.
But the AO was forming higher highs, meaning bullish forces were taking over from bears in driving the market. Another indicator that aligned with a bullish takeover is the Money Flow Index (MFI).
As of this writing, the MFI had risen to 52.09. The MFI measures the flow of money into an asset within a specific period of time. Thus, the increase in the indicator suggests a solid buying momentum for LINK.

So, the token was neither oversold nor overbought. Rather, it indicates that LINK’s trend could be in the upward direction, and there’s a possibility that the value rise as high as $6.50 if buyers sustain the momentum.
Disclaimer: The views, opinions, and information shared in this price prediction are published in good faith. Readers must do their research and due diligence. Any action taken by the reader is strictly at their own risk. Coin Edition and its affiliates will not be liable for direct or indirect damage or loss.
Disclaimer: The information presented in this article is for informational and educational purposes only. The article does not constitute financial advice or advice of any kind. Coin Edition is not responsible for any losses incurred as a result of the utilization of content, products, or services mentioned. Readers are advised to exercise caution before taking any action related to the company.


