


 Price Prediction 2023-2030: Will ZIL Price Reach $0.1 Soon?")
- Bullish Zilliqa (ZIL)price prediction ranges from $0.025 to $0.06.
- Analysis suggests that the Zilliqa price might reach above $0.05.
- The Zilliqa bearish market price prediction for 2023 is $0.0045.
Aside from Bitcoin (BTC) and Ethereum (ETH), there are other digital currencies worth considering for people looking to diversify their portfolios and get experience with new cryptocurrencies, Zilliqa (ZIL) is one of them.
Zilliqa investors are bullish on the token since it has had a return on investment (ROI) of over 13 times in the past two years. The crypto bubble of 2021 led to an increase in the price of ZIL to its present all-time high (ATH) of $0.2563, which was attained in May 2021. Irrespective of the recent crypto winter, ZIL investors are confident that the future of ZIL is bullish.
If you are interested in the future of ZIL and want to know its predicted value for 2023, 2024, 2025, and 2030, keep reading!
Table of contents
- Zilliqa (ZIL) Market Overview
- What is Zilliqa (ZIL)?
- Analysts’ View on Zilliqa (ZIL)
- Zilliqa (ZIL) Current Market Status
- Zilliqa (ZIL) Price Analysis 2023
- Zilliqa (ZIL) Price Prediction 2023-2030 Overview
- Zilliqa (ZIL) Price Prediction 2023
- Zilliqa (ZIL) Price Prediction 2024
- Zilliqa (ZIL) Price Prediction 2025
- Zilliqa (ZIL) Price Prediction 2026
- Zilliqa (ZIL) Price Prediction 2027
- Zilliqa (ZIL) Price Prediction 2028
- Zilliqa (ZIL) Price Prediction 2029
- Zilliqa (ZIL) Price Prediction 2030
- Zilliqa (ZIL) Price Prediction 2040
- Zilliqa (ZIL) Price Prediction 2050
- Conclusion
- FAQ
- More Crypto Price Predictions:
Zilliqa (ZIL) Market Overview
| 🪙 Name | Zilliqa |
| 💱 Symbol | ZIL |
| 🏅 Rank | #344 |
| 💲 Price | $0.0028489065195116 |
| 📊 Price Change (1h) | -0.39 % |
| 📊 Price Change (24h) | -1.56 % |
| 📊 Price Change (7d) | -7.81 % |
| 💵 Market Cap | $57203996.780605 |
| 💸 Circulating Supply | 20079281783.669 ZIL |
| 💰 Total Supply | 20521237209.379 ZIL |
Zilliqa (ZIL) is currently trading at $0.0028489065195116 and sits at number #344 on CoinMarketCap in terms of market capitalization. There are 20079281783.669 ZIL coins currently in circulation, bringing the total market cap to $57203996.780605.
Over the past 24 hours, Zilliqa has decreased by 1.56%. Looking at the last week, the coin is down by 7.81%.
What is Zilliqa (ZIL)?
Zilliqa is a permissionless blockchain platform that supports the mining its native token, ZIL. It was launched in 2017, but its mainnet went live in 2019. The co-founders of Zilliqa are Amrit Kumar and Xinshu Don. Zilliqa is multi-chained and can be traded on the Binance Smart Chain. Zilliqa reached a milestone in January by becoming the first blockchain project to implement Sharding technology. Prateek Saxena first conceived it, but Xinshu Dong was its first CEO when it was registered in June 2017.
Long-term investors can use the private wallets supported on the Zilliqa blockchain to stake their ZIL tokens. This will allow them to earn staking rewards for their investments. This was attained in October 2020 when gambling and yield farming was enabled.
Zilliqa blockchain also supports the creation of adaptable decentralized applications. Creators of non-fungible tokens (NFTs) can also use the platform to create, build and launch their NFT collectibles in the NFT marketplace.
It has good scalability since it can complete 2828 transactions per second. A minimal fee of 0.1 ZIL is charged for transfers within the ZIL platform. This is about $0.0036 from ZIL’s current price of $0.03667.
Analysts’ View on Zilliqa (ZIL)
Crypto Educators and investors on Twitter, CryptoBusy, tweeted that Zilliqa has more room for improvement in the future since a layer- 1 solution, and the first sharding-based blockchain in the world.
Everyone is shocked by the strong performance of $ZIL #Zilliqa
— CryptoBusy (@CryptoBusy) January 9, 2023
Don’t forget that Zilliqa is a layer- 1 solution, and the first sharding-based blockchain in the world! 🔥#BULLISH pic.twitter.com/nIpUbPfmUp
Another tweet by an analyst showing that Zilliqa has a lot of potentials to pump.
Every time $ern touched this tl pumped 2x 4x 2x
— Cryptobull ( Free Premuim Calls ) (@Cryptobullmaker) January 9, 2023
Hoping for a huge pump from #ern soon
Money will soon rotate from high cap gaming nft metaverse coins $gala $zil $gmt $bnx
To low caps like $ern $cocos $voxel $burger etc
A like will be appreciated ❤️ pic.twitter.com/QMeJ5wWmvm
Also, we can even see that Ran Neuner, founder of Crypto Banter made a Youtube live on why the altcoin, Zilliqa was pumping over the few days.
Altcoins are PUMPING!!
— Ran Neuner (@cryptomanran) January 9, 2023
Why is $SOL, $GALA, $ZIL and many other exploding? The most important question is WHICH altcoins are next??? Big show on spotting the next narratives today – it’s staring you in the face!!
LIVE NOW: https://t.co/i9S70A2n1w pic.twitter.com/AEFeYoNGRy
Zilliqa (ZIL) Current Market Status
The maximum supply of Zilliqa (ZIL) is 21,000,000,000 ZIL, while its circulating supply is 15,867,699,447 ZIL, according to CoinMarketCap. At the time of writing, Zilliqa is trading at $0.01605 representing 24 hours increase of 5.86%. The trading volume of Zilliqa in the past 24 hours is $28,540,328 which represents a 120.96% increase.
Some top cryptocurrency exchanges for trading Zilliqa are Binance, Huobi, Bitfinex and Bithumb.
Now that you know Zilliqa and its current market status, we shall discuss the price analysis of Zilliqa (ZIL )for 2023.
Zilliqa (ZIL) Price Analysis 2023
Will the Zilliqa blockchain’s most recent improvements, additions, and modifications help its price rise? Moreover, will the changes in the payment and crypto industry affect ZIL’s sentiment over time? Read more to find out about Zilliqa’s 2023 price analysis.
Zilliqa (ZIL)Price Analysis – Bollinger Bands
The Bollinger bands are a type of price envelope developed by John Bollinger. It gives a range with an upper and lower limit for the price to fluctuate. The Bollinger bands work on the principle of standard deviation and period (time).
The upper band as shown in the chart is calculated by adding two times the standard deviation to the Simple Moving Average while the lower band is calculated by subtracting two times the standard deviation from the Simple Moving Average.
From the above chart, we can see that ZIL has been losing value since late April 2023. Although ZIL tried to consolidate on different levels, the bears were too strong and the selling pressure was too high. As such, ZIL crashed until it received support at $0.017. Thereafter it gained some momentum and increased, however, once again the bears took over the market and ZIL crashed again.
After touching the lower Bollinger band, ZIL is currently increasing. The formation of a large green candlestick shows the presence of buyers in the market. If the buyers keep increasing and overhauling the sellers, then ZIL may reach the SMA, or it could even break the SMA and reach the upper Bollinger Band.
When considering the chart above, we can see that ZIL has a downtrend followed by an uptrend which then was followed by a downtrend as highlighted in the chart. Since it looks like the downtrend has ended, there is a possibility that ZIL could start the next uptrend. Moreover, the squeezing Bollinger bands denote that there is less volatility in the market. This means that the sellers and buyers are almost in equal numbers, hence, the price fluctuation is minimal. However, the Bollinger band width percentile indicator shows a value of 25.4% and it is placed parallel to the horizontal. Hence, there may be consolidation for ZIL in the future.
Zilliqa (ZIL) Price Analysis- Relative Strength Index
The Relative Strength Index is an indicator that is used to measure whether the price of a cryptocurrency is over or undervalued. For this purpose, it has two extreme regions known as the overbought and oversold regions.
When the RSI reads a value (>70) then the crypto is overbought, which means that due to more buying the demand has increased as such the price has also increased. On the other hand, when it is oversold, many are selling, as such, its price is undervalued.
When looking at the above chart, we can see that the RSI for ZIL is increasing. It reads a value of 39.76 and the line seems to be increasing. Since ZIL is neither overbought nor oversold, it could be counted as the trend is strong. However, when the number of buyers increases in the market, there is a high chance that the RSI could increase.
Moreover, the RSI could also be used to find divergence in the market. For instance, the RSI usually follows the crypto’s price movements. When the crypto makes a higher high, the RSI should also make a higher high. However, if it makes a lower high, then this is a bearish divergence.
Zilliqa (ZIL) Price Analysis – Moving Average
The exponential moving average is not much different from the simple moving average. The EMA gives more weightage to the present prices while the SMA equally distributes the values to the frequency. Hence, when the EMA is plotted in the graph it gives a rough idea about how the cryptocurrency has been performing in the past.
Moreover, the 50-day EMA is considered the short-term length, and the 200-day EMA is considered the long-term. Whenever the 50-day EMA crosses the 200-day EMA from below it is called a Golden cross, while if it crosses from above, then it is a death cross. However, in this case, we will be using the 50-day EMA as the long-term length and the 10-day EMA as the short-term length.
The chart above shows that ZIL has been testing the 50-day EMA quite a few times but was rejected on every occasion. It has been making lower lows once it was rejected at the 50-day EMA. Moreover, since both EMAs are moving in a downward direction, it shows that ZIL is bearish in the short and long terms.
However, when ZIL reaches the bottom and the buyers start buying the dip, then there is a high chance that ZIL could test the 50-day EMA. Furthermore, if the 50-day EMA is broken, then, the chance of ZIL reaching the 200-day EMA is very high.
Zilliqa (ZIL) Price Prediction 2023-2030 Overview
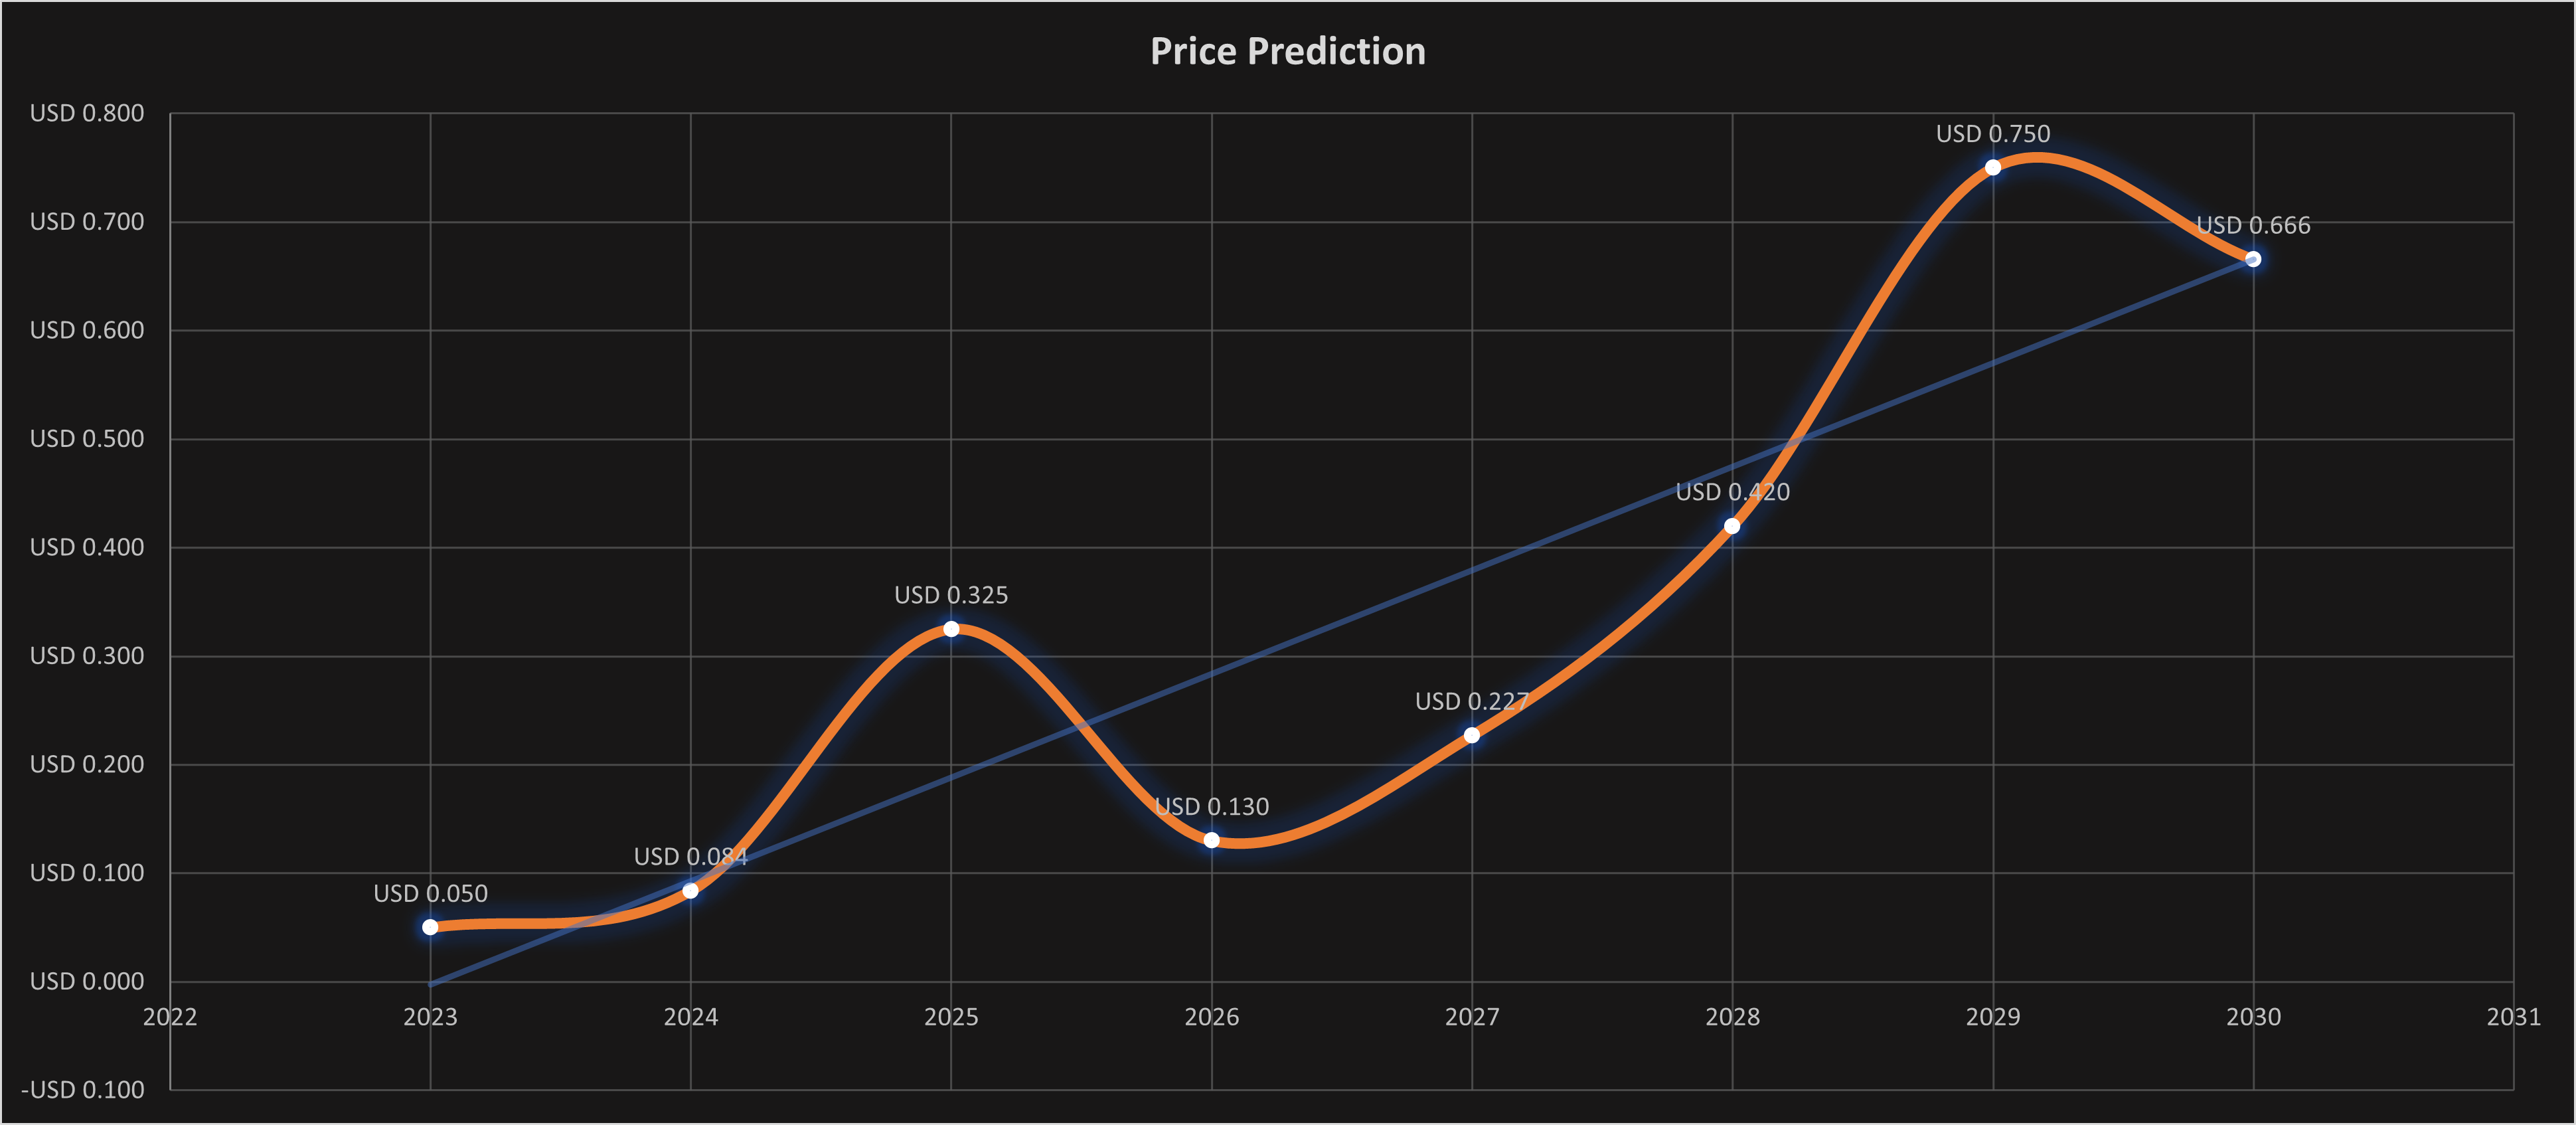
| Year | Minimum Price | Average Price | Maximum Price |
| 2023 | $0.02 | $0.05 | $0.08 |
| 2024 | $0.075 | $0.084 | $0.095 |
| 2025 | $0.20 | $0.325 | $0.45 |
| 2026 | $0.09 | $0.130 | $0.2 |
| 2027 | $0.19 | $0.227 | $0.350 |
| 2028 | $0.375 | $0.420 | $0.550 |
| 2029 | $0.600 | $0.750 | $0.900 |
| 2030 | $0.550 | $0.680 | $0.800 |
| 2040 | $1.25 | $1.73 | $2.25 |
| 2050 | $1.5 | $2.8 | $4 |
Zilliqa (ZIL) Price Prediction 2023
As shown in the above chart, ZIL is trading inside a falling wedge. There is a high chance that it could break out of the falling wedge at any given time. As the buying pressure is increasing, there is a high chance that the ZIL could reach $0.05. However, before reaching the aforementioned resistance level, there are two resistance levels to clear at $0.026 and $0.036. Moreover, the fixed volume profile indicator shows that there is more trading happening around $0.032. Hence, the chances of ZIL reaching this level are quite high.
Contrastingly, if ZIL doesn’t break out of the wedge conventionally, then, there is a high chance that it could break the support at $0.013 and reach $0.0045.
Zilliqa (ZIL) Price Prediction – Resistance and Support Levels
When considering the chart above, we can see that ZIL had a spike during April 2021. It reached above $0.25. Thereafter, it started to descend just below the 2:1 Gann line but above the 1:1 Gan line. Although at some point it seemed like the 8:1 Gann line would support ZIL. However, it couldn’t support ZIL as the bears were too strong. Currently, ZIL is moving sideways and there is a high chance that it could keep consolidating.
Zilliqa (ZIL) Price Prediction 2024
There will be Bitcoin halving in 2024. Hence, we should expect a positive trend in the market due to user sentiments and the quest by investors to accumulate more of the coin. However, the year of BTC halving didn’t yield the maximum for Zilliqa based on the previous halving. Hence, we could expect Zilliqa to trade at a price, not below $0.084 by the end of 2024.
Zilliqa (ZIL) Price Prediction 2025
Zilliqa may experience the after-effects of the Bitcoin halving and is expected to trade much higher than its 2024 price. Many trade analysts speculate that BTC halving could create a huge impact on the crypto market. Moreover, similar to many altcoins, Zilliqa will continue to rise in 2025 forming new resistance levels. It is expected that Zilliqa will trade beyond the $0.325 level.
Zilliqa (ZIL) Price Prediction 2026
It is expected that after a long period of bull run, the bears will come into power and start negatively impacting the cryptocurrencies. During this bearish sentiment, Zilliqa could tumble into its support regions. During this period of price correction, Zilliqa could lose momentum and be way below its 2025 price. As such, it could be trading at $0.13 by 2026.
Zilliqa (ZIL) Price Prediction 2027
Naturally, traders expect a bullish market sentiment after the crypto industry was affected negatively by the bears’ claw. Moreover, the build-up to the next Bitcoin halving in 2028 could evoke excitement in traders. However, there’ll be a dip in price before the excitement will be reciprocated in EOS. As such, we could expect Zilliqa to trade at around $0.227 by the end of 2027.
Zilliqa (ZIL) Price Prediction 2028
As the crypto community’s hope will be re-ignited looking forward to Bitcoin halving like many altcoins, Zilliqa may reciprocate its past behavior during the BTC halving. Hence, Zilliqa would be trading at $0.42 after experiencing a considerable surge by the end of 2028.
Zilliqa (ZIL) Price Prediction 2029
2029 is expected to be another bull run due to the aftermath of the BTC halving. However, traders speculate that the crypto market will gradually become stable by this year. In tandem with the stable market sentiment, Zilliqa could be trading at $ 0.75 by the end of 2029.
Zilliqa (ZIL) Price Prediction 2030
After witnessing a bullish run in the market, Zilliqa and many altcoins would show signs of consolidation and might trade sideways and move downwards for some time while experiencing minor spikes. Therefore, by the end of 2030, Zilliqa could be trading at $0.68.
Zilliqa (ZIL) Price Prediction 2040
The long-term forecast for Zilliqa indicates that this altcoin could reach a new all-time high(ATH). This would be one of the key moments as HODLERS may expect to sell some of their Coins at the ATH point.
If they start selling then Zilliqa could fall in value. It is expected that the average price of Zilliqa could reach $1.73 by 2040.
Zilliqa (ZIL) Price Prediction 2050
Since Cryptocurrency will be revered and widely accepted by most people during the 2050s, we will see the masses believe more in it. As such Zilliqa could reach $2.8.
Conclusion
If investors continue showing their interest in Zilliqa and add these tokens to their portfolio, it could continue to rise. ZIL’s bullish price prediction shows that it could reach the $0.05 level
FAQ
Fetch.AI is an artificial intelligence (AI) lab developing an open, permissionless, decentralized machine learning network with a crypto economy. It was founded in 2017 and debuted via IEO on Binance in March 2019. With a permissionless network that anyone can join and use to obtain secure datasets, Zilliqa democratizes access to AI technology. It uses autonomous AI to carry out tasks using its extensive global data network. The optimization of DeFi trading services, transportation networks (parking, micro-mobility), smart energy grids, travel, and virtually any other intricate digital system that depends on sizable datasets are among the use cases that the Fetch.AI paradigm is based on.
ZIL can be traded on many exchanges like other digital assets in the crypto world. Binance, Kucoin, Huobi Global, Gate.io are currently the most popular cryptocurrency exchanges for trading ZIL.
Since ZIL provides investors with several opportunities to profit from their crypto holdings, it seems to be a good investment in 2022. Notably, ZIL has a high possibility of surpassing its current ATH in 2027.
ZIL is expected to continue its upward trend as one of the fastest-rising cryptocurrencies. We may also conclude that ZIL is an excellent cryptocurrency to invest in this year, given its recent partnerships and collaborations that have improved its adoption.
Zilliqa is one of the few cryptocurrencies that has retained its bullish momentum in the past seven days. If this momentum is maintained, Zilliqa might reach $0.05 soon.
Zilliqa has a present all-time low price of $0.002477.
ZIL was launched in 2017.
Prateek Saxena co-founded ZIL.
The maximum supply of ZIL is 21,000,000,000 ZIL.
ZIL can be stored in a cold wallet, hot wallet, or exchange wallet.
Zilliqa is expected to reach $0.05 by 2023.
Zilliqa is expected to reach $0.084 by 2024.
Zilliqa is expected to reach $0.325 by 2025.
Zilliqa is expected to reach $0.130 by 2026.
Zilliqa is expected to reach $0.227 by 2027.
Zilliqa is expected to reach $0.420 by 2028.
Zilliqa is expected to reach $0.75 by 2029.
Zilliqa is expected to reach $0.68 by 2030.
Zilliqa is expected to reach $1.73 by 2040.
Zilliqa is expected to reach $2.8 by 2050.
Disclaimer: The views and opinions, as well as all the information shared in this price prediction, are published in good faith. Readers must do their own research and due diligence. Any action taken by the reader is strictly at their own risk. Coin Edition and its affiliates will not be held liable for any direct or indirect damage or loss.
More Crypto Price Predictions:
- Stacks (STX) Price Prediction: Will STX Price Hit $1 Soon?
- STEPN (GMT) Price Prediction: Will GMT Price Hit $1 Soon?
- Bitcoin Gold (BTG) Price Prediction: Will BTG reach $60 Soon?
- Kusama (KSM) Price Prediction: Will KSM Price Hit $150 Soon?
Disclaimer: The information presented in this article is for informational and educational purposes only. The article does not constitute financial advice or advice of any kind. Coin Edition is not responsible for any losses incurred as a result of the utilization of content, products, or services mentioned. Readers are advised to exercise caution before taking any action related to the company.
 Price Prediction 2026-2030: Will TRX Hit $0.50 Soon?")
 Price Prediction 2026-2050: Will HYPE Hit $100 Soon?")


: What Happens If You Use an Unlicensed Platform?")