
- In a recent price review, the price of BTC increased by 0.18%
- Will the bullish trend’s momentum fade quickly?
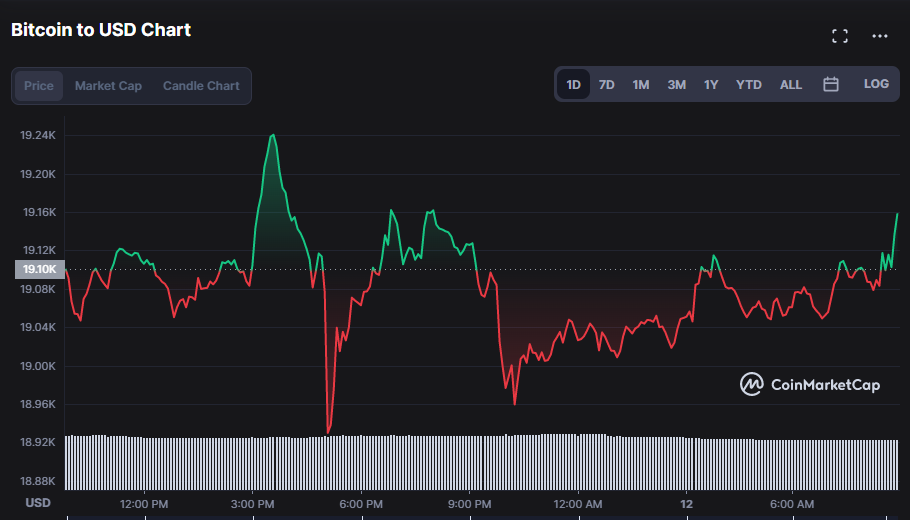
- On the previous day, BTC finds support at $18,925.60 and resistance at $19,241.96.
The daily Bitcoin (BTC) price chart shows that the digital currency’s price has dramatically gone up a lot in the last few hours. The bulls have successfully prevailed and taken control of the market in the last few hours after the market experienced a slump and sell-off for several weeks.
BTC has risen by 0.18% in the last few hours to trade at $19,144.37. Although the 24-hour trading volume has decreased by 7.06% to $27,281,429,330, the market capitalization has climbed by 0.28% to $367,187,823,054.
The majority of the technical indicators on the daily price chart point in the direction of a decline, which raises the possibility that the rising momentum displayed by BTC may only be temporary.
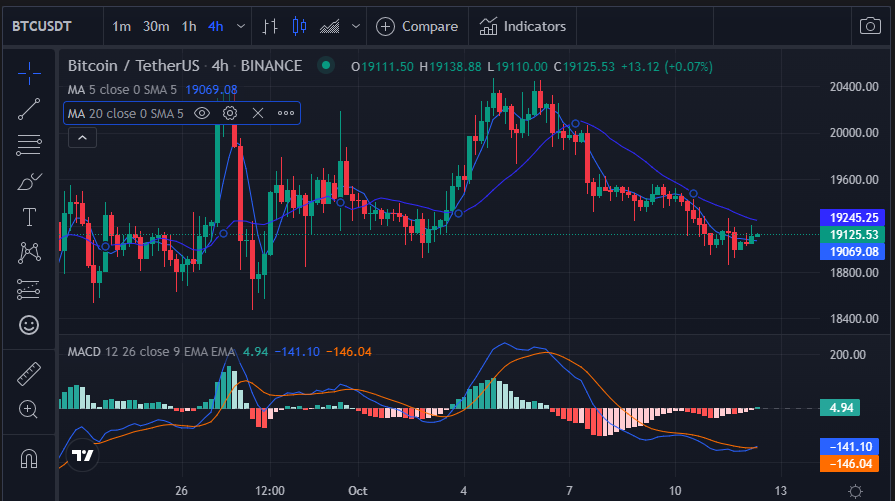
A bearish crossover is indicated on the BTC/USD price chart when the 5-day Moving Average crosses below the 20-day Moving Average. The MA is located at 19069.89, while the 20-day MA is 19245.81. The price chart also shows a negative tendency, which is a decline. However, only the 5-day MA is below the market; that may be bullish.
Recent charts show that the MACD line has crossed above the signal line, a positive momentum since the MACD line had previously been below the signal line. However, because the MACD line is still in the negative region, it is not fully certain that the bullish momentum will last for long. While the signal line contacts -146.04, the blue MACD line hits -141.10.
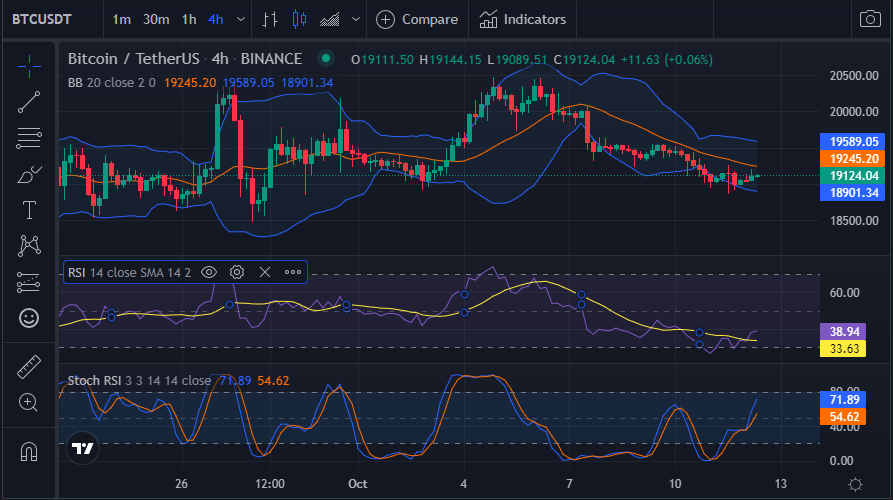
The Bollinger Bands are starting to bulge on the daily charts, which is a bullish sign because market volatility has increased. The price, however, is swaying in favor of the bottom band, suggesting that the rising momentum may not last for long. At $19589.12 and $18901.51, the top and lower bands make touch with one another.
The Relative Strength Index (RSI) shows a line that touches 38.94 and a rising gradient that is edging away from the 30-oversold boundary and steadily climbing to the 50-center line. If the RSI score is steady, this can be a bullish indicator because it means that buying and selling activities are equal.
The Stoch RSI, which currently reads 72.55, is getting close to the overbought zone of 80. This could signify that the RSI is approaching its recent extreme readings, which are bullish, and will reverse its prices downward.
Overall, if the bears take control of the market, the present bullish trend on the charts will be invalidated; but if the bulls successfully defend the resistance and push prices higher, the bullish momentum will continue.
Disclaimer: The views and opinions, as well as all the information shared in this price analysis, are published in good faith. Readers must do their own research and due diligence. Any action taken by the reader is strictly at their own risk. Coin Edition and its affiliates will not be held liable for any direct or indirect damage or loss.
Disclaimer: The information presented in this article is for informational and educational purposes only. The article does not constitute financial advice or advice of any kind. Coin Edition is not responsible for any losses incurred as a result of the utilization of content, products, or services mentioned. Readers are advised to exercise caution before taking any action related to the company.
")


