


- Litecoin’s (LTC) price analysis shows positive momentum.
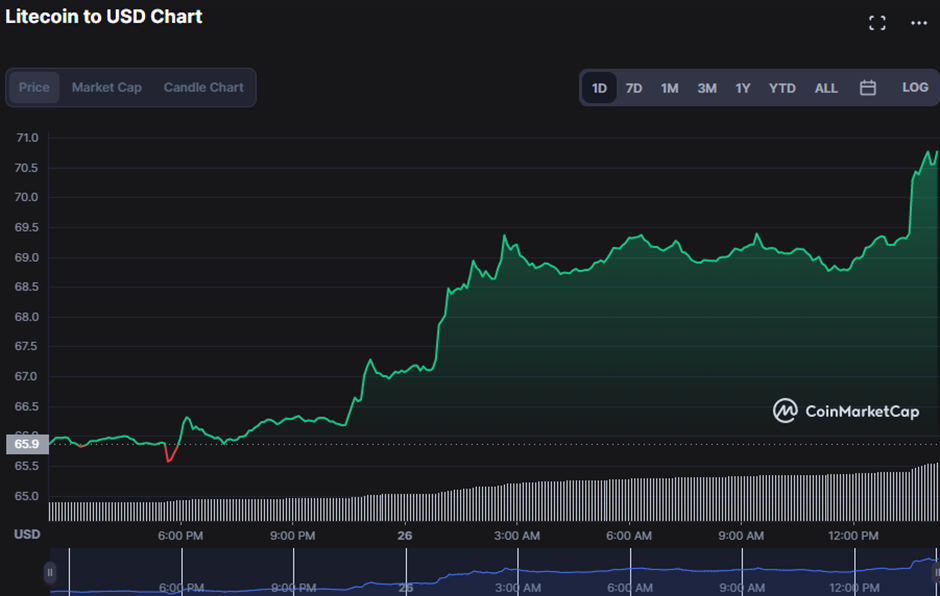
- LTC prices rise by 7.20% to $70.84 as of press time.
- The bullish trend seems likely to persist in the foreseeable future, as per technical indicators.
The Litecoin (LTC) bulls have dominated the market today, with the bears’ efforts to drive prices lower futile after they drove prices to an intraday low of $65.54. As a consequence of the increased demand, the price of LTC jumped to $70.84 (a gain of over 7.52%).
The 24-hour trading volume increased by 232.75% to $524,028,131, while the market cap increased by 7.31% to $5,086,433,850, indicating strong buying activity.
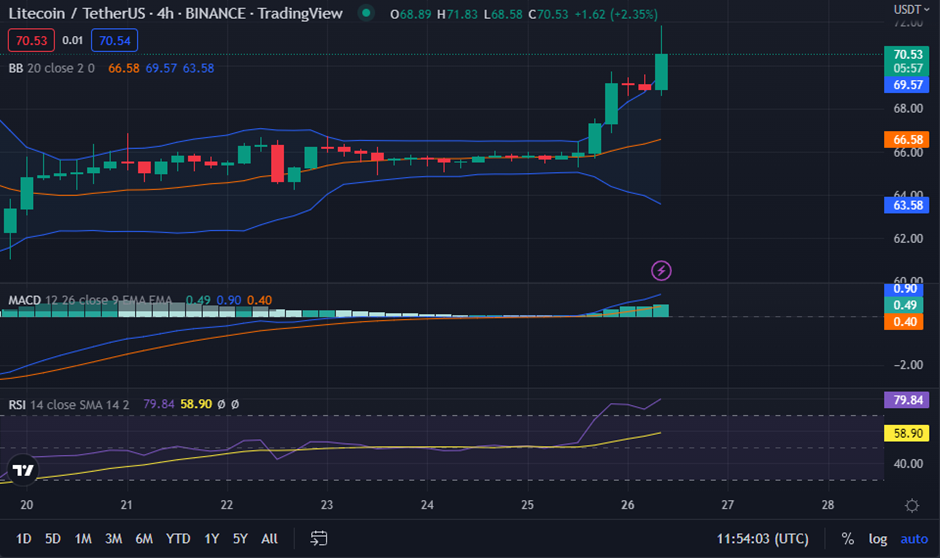
The Moving Average Convergence Divergence (MACD) is heading higher and in the positive range, with a value of 0.91. Also, the MACD blue line going above the signal line shows that LTC is likely to keep going in a positive direction.
The bulging Bollinger Bands imply increased selling and buying activity. To add to the market’s current bullish mood, the market is moving up above both bands, which shows that bulls are getting stronger. The bottom band hits $63.56 while the top band touches $69.58, demonstrating this.
The Relative Strength Index (RSI) is now at 79.90 and is heading toward overbought, which means that buying pressure is building. In this case, the RSI shows that LTC bullish control is at its highest point, which is a warning that the market is likely to fall.
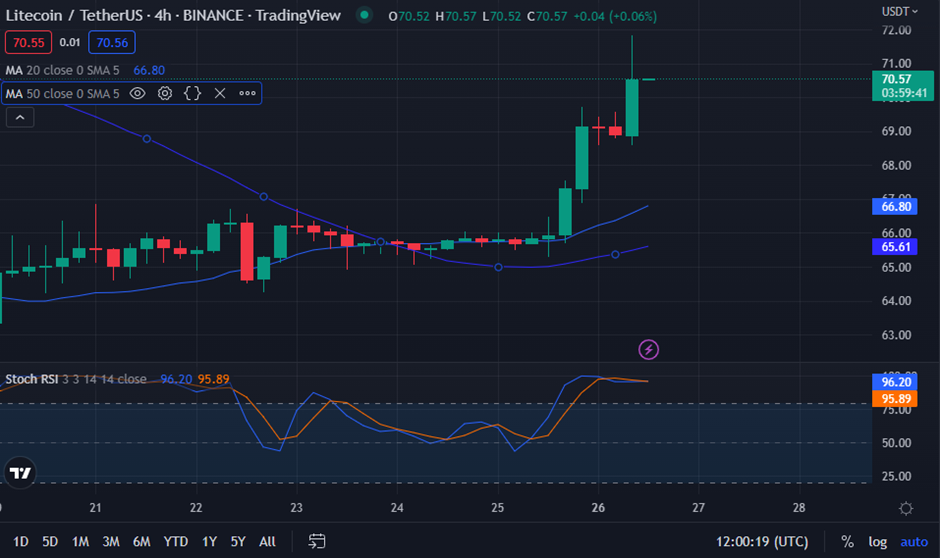
The 50-Day MA and 20-Day MA both touch 65.48 and 66.57, respectively. This action signals a “golden cross” (bullish crossover), which is backed by the market price rising above both moving averages.
However, the Stoch RSI score of 95.73 suggests that it has reached the overbought zone. This signal warns traders that the current market trend may be coming to an end and prices may regress downward, causing traders to be alarmed.
For the current bullish trend in Litecoin (LTC) prices to continue, the bulls need to keep the resistance level in place.
Disclaimer: The views and opinions, as well as all the information shared in this price prediction, are published in good faith. Readers must do their research and due diligence. Any action taken by the reader is strictly at their own risk. Coin Edition and its affiliates will not be held liable for any direct or indirect damage or loss.
Disclaimer: The information presented in this article is for informational and educational purposes only. The article does not constitute financial advice or advice of any kind. Coin Edition is not responsible for any losses incurred as a result of the utilization of content, products, or services mentioned. Readers are advised to exercise caution before taking any action related to the company.
 Price Prediction 2026-2030: Will LTC Hit $80 Soon?")


 Price Prediction 2026, 2027, 2028, 2029, 2030-2050")
