


- Michael van de Poppe predicted yesterday that the price of XCAD could climb as high as $2.75-$3.00 soon.
- At press time, XCAD was worth $1.15 after its price rose by over 3% in the past day.
- Technical indicators on the token’s daily chart suggested that XCAD’s price may continue to rise.
The well known cryptocurrency trader and analyst, Michael van de Poppe, shared in an X post yesterday that the price of XCAD Network (XCAD) could start making a move up soon as the altcoin market is starting to break up and shift its trend. In his post, the analyst highlighted the importance of XCAD breaking past the strong $1.50 resistance.
If XCAD is able to flip this level, van de Poppe believes the altcoin could look to target $2.05. In an extremely bullish case, he believes XCAD’s price could even climb to between $2.75-$3.00.
Considering XCAD’s 24 hour performance, it seems like van de Poppe’s prediction for the altcoin had some merit to it. According to data from the market tracking website, CoinMarketCap, XCAD saw its price rise by 3.78% throughout the past day.
As a result, XCAD was trading at $1.15, which was right between its 24 hour high price of $1.20 and its daily low price of $1.10. In addition to its price rise, XCAD’s intraday volume was able to climb to around $14,831,635 after a more than 55% increase since yesterday.
The token’s market cap also rose to $53,478,040, which ranked XCAD as the 451st largest cryptocurrency by market capitalization. The token’s price success over the past day also pushed up its weekly performance to +17.96%.
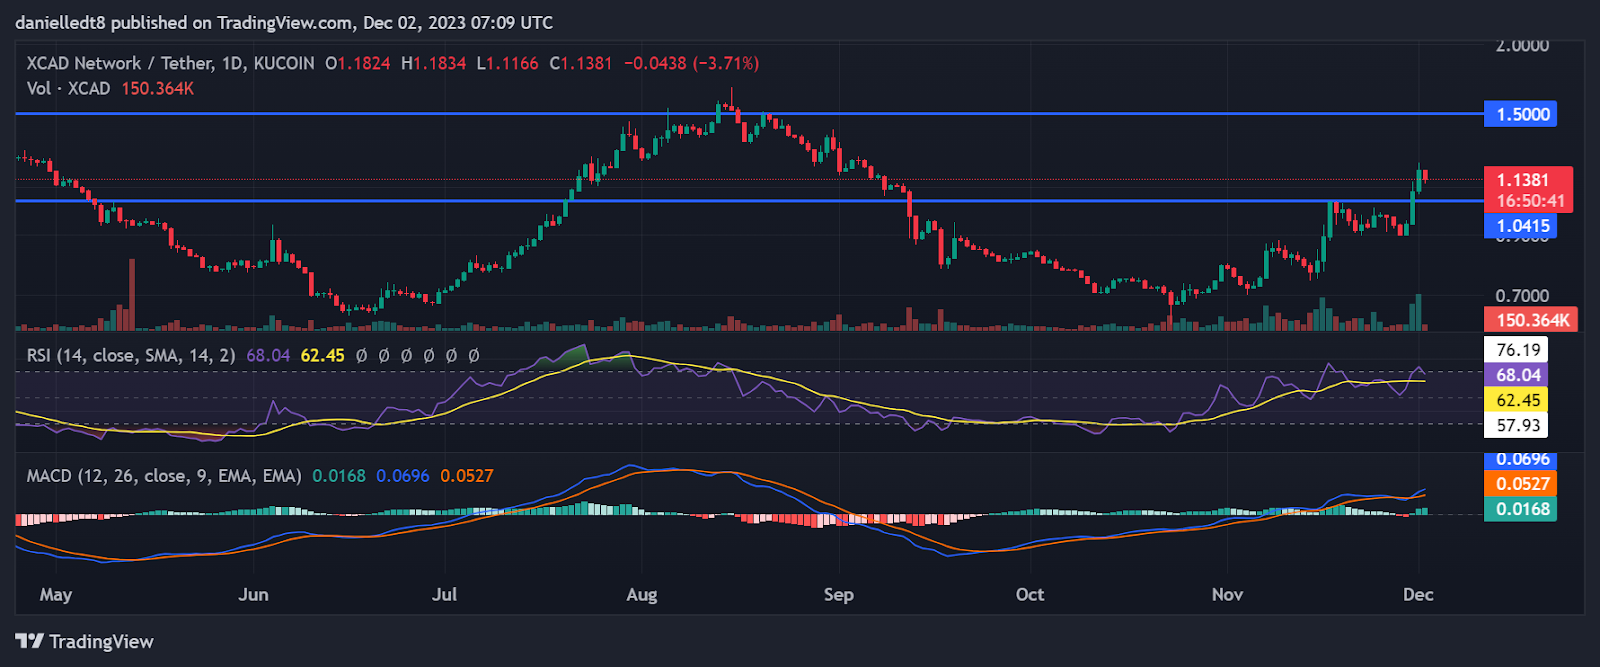
XCAD was able to break above the $1.0415 resistance level throughout the past few days and continued to trade above this level at press time. A daily candle close above this mark today could lead to the altcoin rising to the $1.50 resistance level highlighted in van de Poppe’s post.
Technical indicators on the cryptocurrency’s daily chart suggested that XCAD’s price may continue to rise in the coming couple of days. At press time, the daily Moving Average Convergence Divergence (MACD) indicator was flagging bullish. The MACD line positioned above the MACD Signal line could be indicative of XCAD being in a positive trend.
Furthermore, the MACD line was breaking away above the MACD Signal line. This may be seen as a sign that XCAD’s positive trend was growing stronger. Meanwhile, the Relative Strength Index (RSI) indicator also expressed bullishness and that buyers had the upper hand over sellers.
However, the negative slope of the RSI line may indicate that buyers had lost some of their strength. Should the RSI line cross below the RSI Simple Moving Average (SMA) line, XCAD may pull back to the previously-breached $1.0415 mark.
Disclaimer: The information presented in this article is for informational and educational purposes only. The article does not constitute financial advice or advice of any kind. Coin Edition is not responsible for any losses incurred as a result of the utilization of content, products, or services mentioned. Readers are advised to exercise caution before taking any action related to the company.
 Price Prediction: Can BTW Sustain Its Breakout Above $0.1032?")


