


- EGRAG CRYPTO predicted that XLM may reach $1 in the coming weeks.
- In his post, the analyst revealed that the 21 EMA was closing in on the 200 MA on XLM’s weekly chart.
- Meanwhile, a symmetrical triangle chart pattern on XLM’s daily chart suggested that its price may break out soon.
EGRAG CRYPTO, a cryptocurrency trader and analyst, predicted in a tweet earlier today that Stellar (XLM) may reach $1 in the medium term. The analyst based his bullish prediction off of the fact that a significant medium-term technical flag was on the cusp of being triggered.
In the post, EGRAG CRYPTO revealed that the 21 EMA line on XLM’s weekly chart was closing in on the 200-week MA line. Should these two technical indicators cross in the coming few weeks, it may be followed by a 500% increase in the cryptocurrency’s price, according to the analyst.
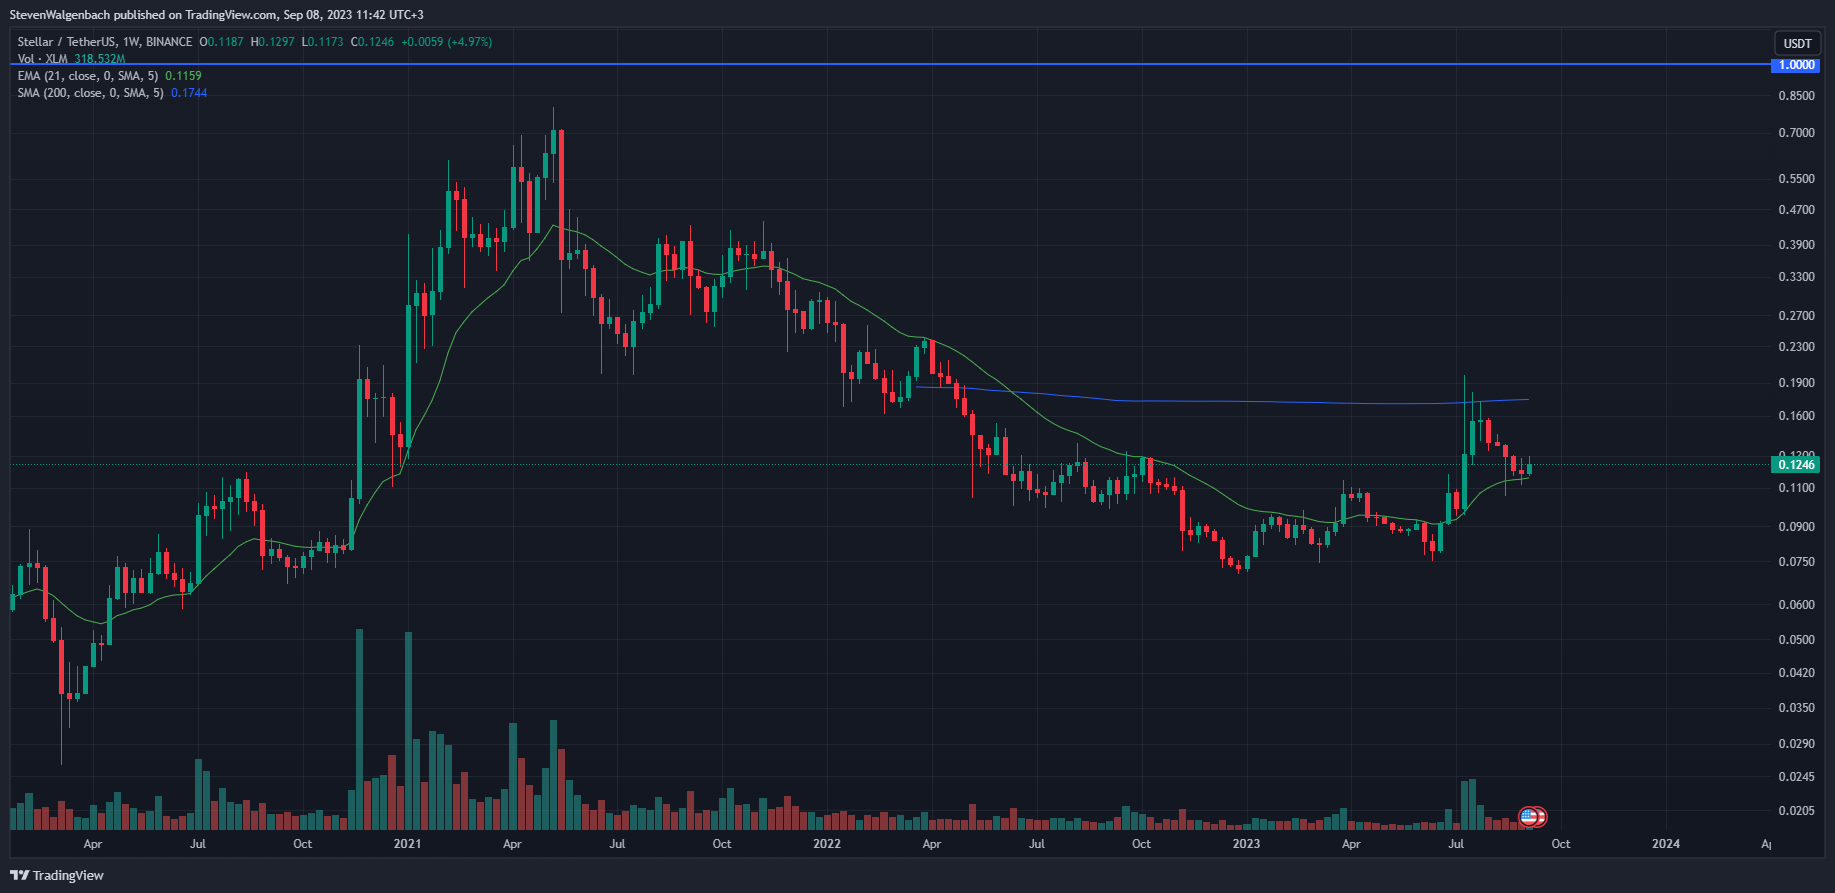
Subsequently, EGRAG CRYPTO believes that XLM’s price could rise to $1 in the months after the bullish cross. He also added that the altcoin’s price may have the momentum needed to rise to $1.10 as well.
Meanwhile, CoinMarketCap indicated that XLM’s price had risen 1.22% throughout the past 24 hours of trading. Subsequently, the cryptocurrency was trading hands at $0.1245 at press time. XLM had established a daily low of $0.1181 and was trading at its 24-hour high. This suggested that the altcoin’s price may retrace in the next 24 hours if traders begin to make a profit.
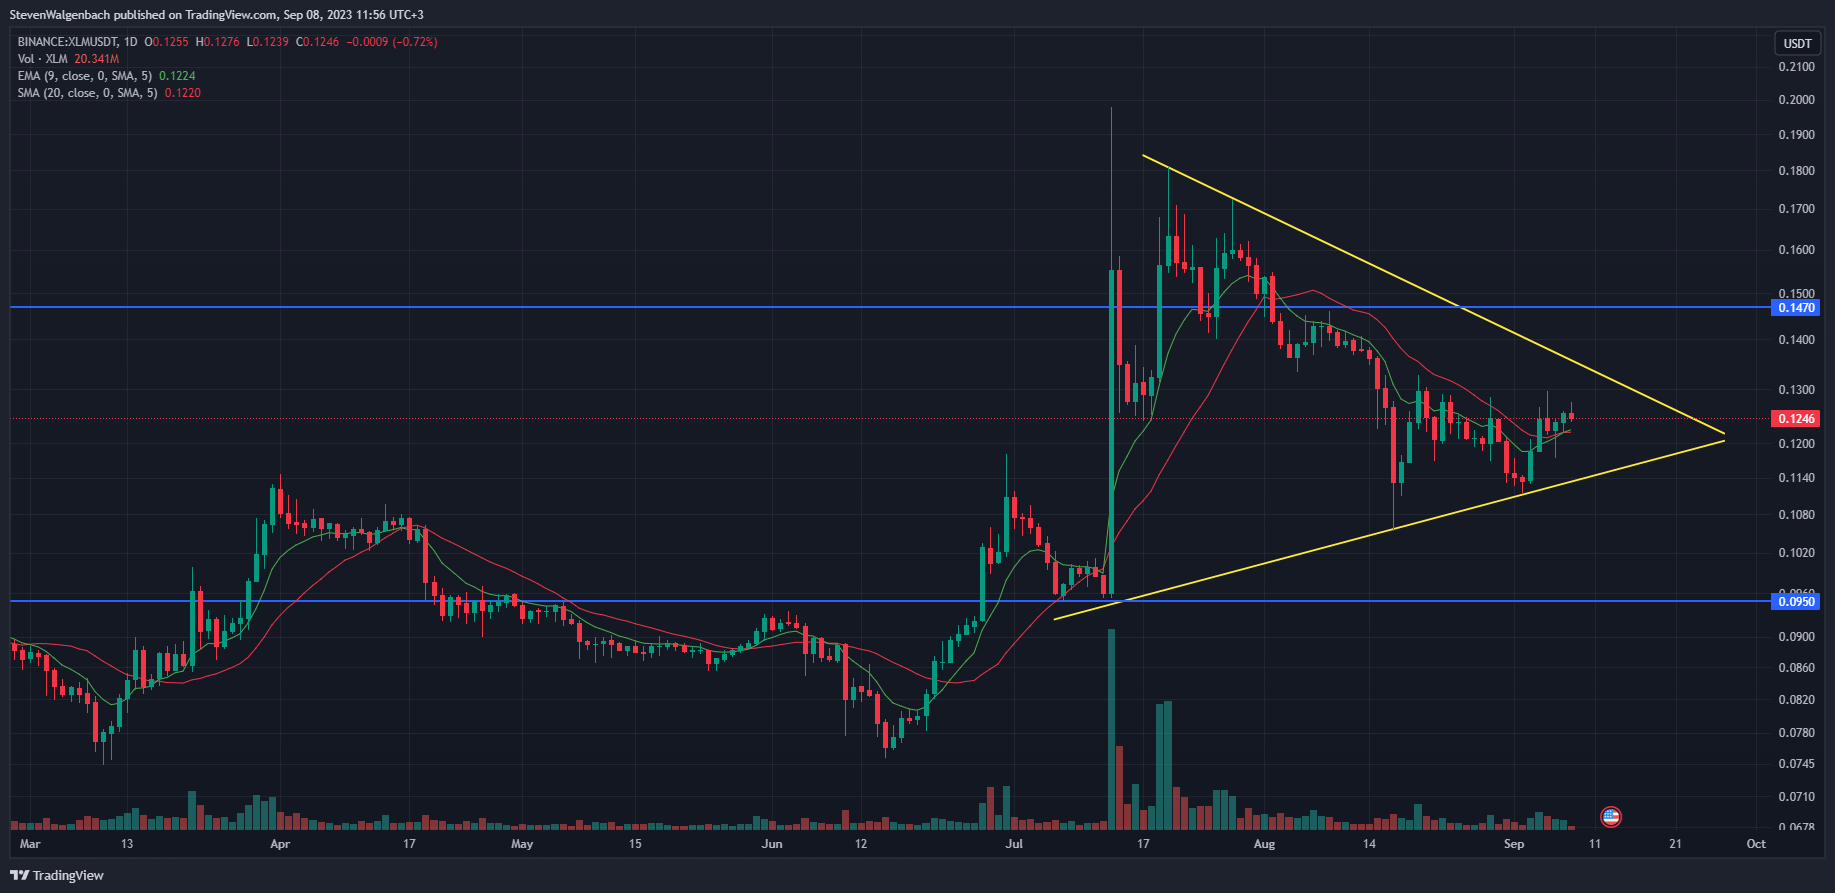
From a shorter-term perspective, a symmetrical triangle pattern had formed on XLM’s daily chart. This chart pattern suggested that a price breakout may be in the cards for the altcoin. If this potential move is towards the upside, then XLM’s price could soar to as high as $0.1470 in the coming 2-3 weeks.
Conversely, a negative breakout may lead to XLM falling to the crucial support level at $0.0950. The bullish breakout may be more likely to occur given the fact that the 9-day EMA recently crossed above the 20-day EMA line on XLM’s chart. This signaled that short-term momentum had shifted in favor of bulls over the past 48 hours.
Disclaimer: The views and opinions, as well as all the information shared in this price analysis, are published in good faith. Readers must do their own research and due diligence. Any action taken by the reader is strictly at their own risk. Coin Edition and its affiliates will not be held liable for any direct or indirect damage or loss.
Disclaimer: The information presented in this article is for informational and educational purposes only. The article does not constitute financial advice or advice of any kind. Coin Edition is not responsible for any losses incurred as a result of the utilization of content, products, or services mentioned. Readers are advised to exercise caution before taking any action related to the company.


