


- The CEO of Eight Global tweeted “That worked out on $XRP”, indicating XRP crossing $0.4.
- If $0.395 support fails to hold XRP, then $0.35 would be the next support to look for: Michael.
- XRP fluctuates in a bearish rising wedge. It could hit resistance 1 if the bull pushes hard.
Chief Executive Officer and Founder of Eight Global Michael van de Poppe tweeted “That worked out on $XRP.” Although his preceding statement fails to explicitly explain what he meant, it could be assumed that he referred to XRP breaking the $0.4 mark.
Besides that, he fancies seeing a $0.395 hold as support for XRP. However, if that support level fails to hold XRP, then he predicts that the next support level that could hold XRP was $0.35.
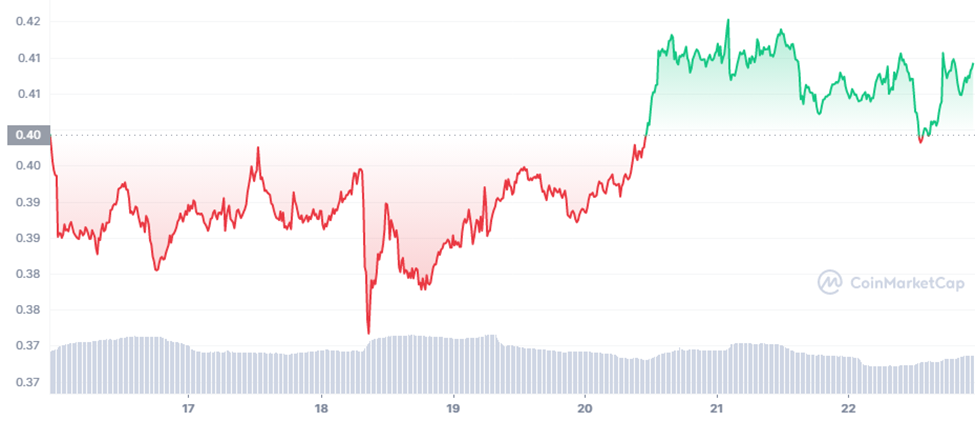
XRP opened the market with its price at $0.40 and thereafter immediately sank into the red zone as shown in the chart below. Although on numerous occasions XRP tried to rise above the opening market price, the bears were too strong. Hence, XRP was in the red zone for almost four and a half days. While the token abode in the red zone, it reached its lowest price of $0.3717 on the second day.
However, with the bulls pushing hard on the fourth day, XRP broke above its opening market price and reached its highest price of $0.4152 on the fifth day of the week. After it entered the green zone, XRP has been consolidating in the $0.40-$0.42 range.
Read Also: XRP Price Prediction
When considering the chart below, XRP has been trading testing the 200-day MA since late December. Despite touching the 200-day MA and at the time breaking it, the bulls failed to give momentum to XRP, hence it crashed below the 200-day MA again. Currently, XRP is trading in a bearish rising wedge.
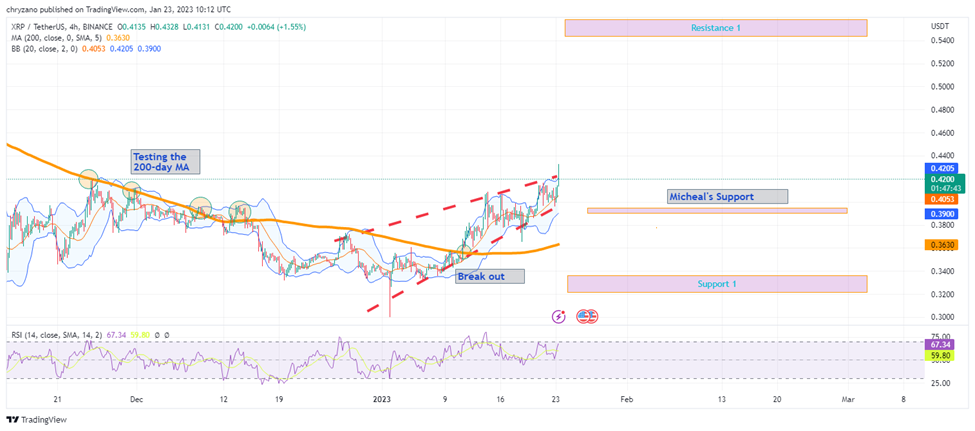
Notably, on every previous occasion when XRP tested the 200-day MA, it simultaneously touched the upper Bollinger band, and the RSI was neither in the overbought nor oversold region. Contrastingly, during the breakout, XRP breached the 200-day MA despite touching the upper Bollinger band.
Since XRP is above the 200-day MA and is touching the upper Bollinger band, hence, just as the previous time above the 200-day MA, XRP could keep surging. The bulls may be able to take XRP to resistance 1. Nonetheless, if the bears take over XRP may tank to Michael Support, as shown in the chart or even support 1.
Disclaimer: The views and opinions, as well as all the information shared in this price analysis, are published in good faith. Readers must do their own research and due diligence. Any action taken by the reader is strictly at their own risk, Coin Edition and its affiliates will not be held liable for any direct or indirect damage or loss.
Disclaimer: The information presented in this article is for informational and educational purposes only. The article does not constitute financial advice or advice of any kind. Coin Edition is not responsible for any losses incurred as a result of the utilization of content, products, or services mentioned. Readers are advised to exercise caution before taking any action related to the company.


 Price Prediction 2026, 2027, 2028, 2029, 2030-2050")
