


- Khaled Elawadi.XRP shared that he will begin accumulating XRP each week in the coming months.
- He also shared that XRP under $1 is a steal and does not care if the altcoin’s price goes up or down.
- At press time, XRP was trading hands at $0.6516 following a 3.27% 24-hour gain.
An analyst that goes by the X username Khaled Elawadi.XRP revealed in a post today that he will begin stacking Ripple (XRP) each week. He also added that he will be “buying anything that moves under $1.” He concluded his post by sharing that he is not concerned about whether the remittance token’s price goes up or down.
Meanwhile, CoinMarketCap data indicated that the cryptocurrency was able to record a 3.27% gain throughout the past day of trading. As a result, XRP’s price has climbed to trade at $0.6516 at press time. Despite this latest gain, XRP still had some work to do to escape its negative weekly performance, which stood at -6.41%.
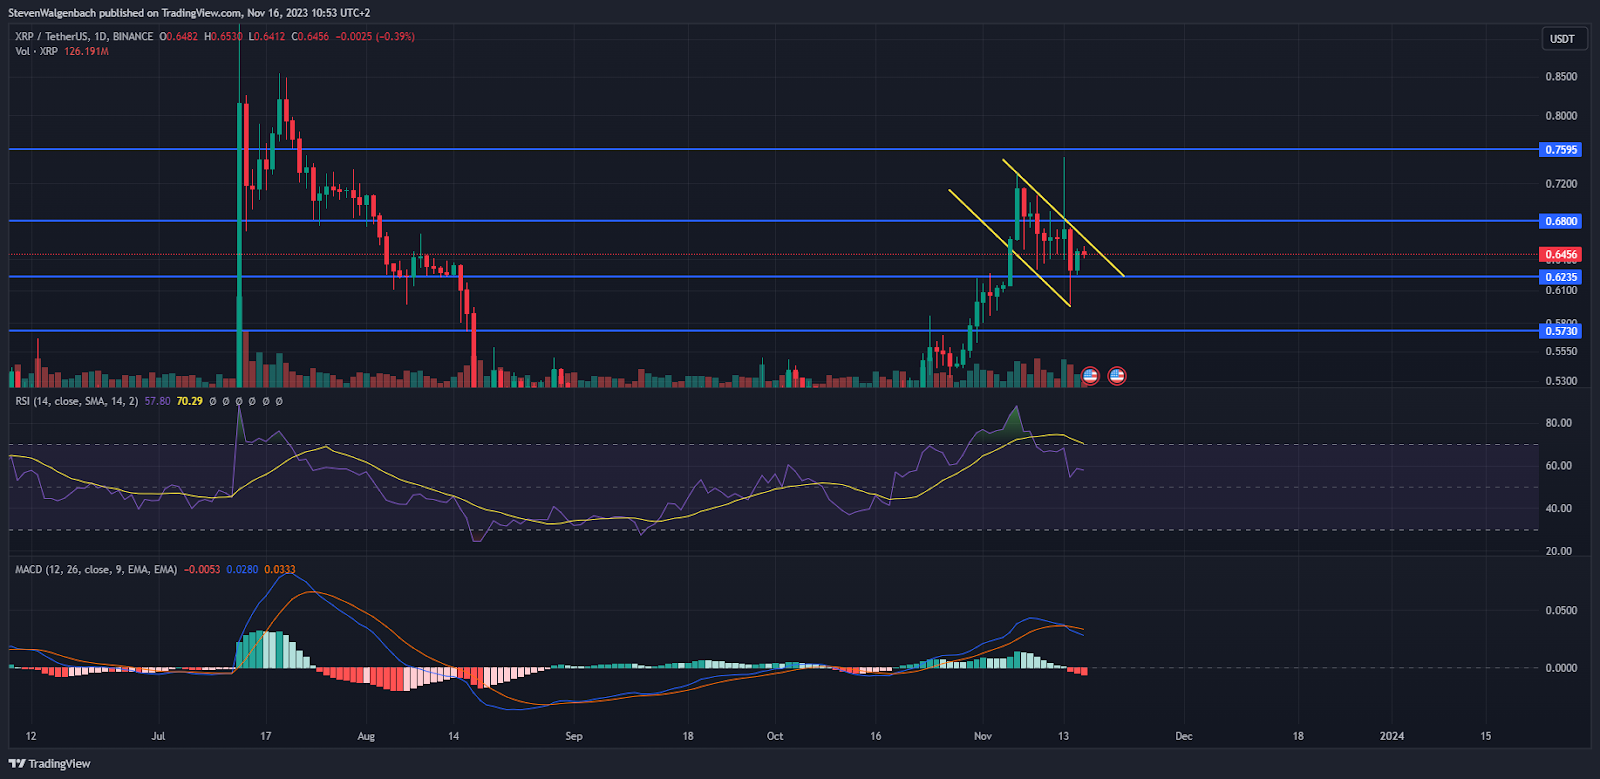
XRP was attempting to break out of a negative price channel. Should it be able to escape this channel, it may attempt to flip the $0.6800 resistance level into support in the following couple of days. Thereafter, continued buy pressure could elevate the altcoin’s price to the next major resistance level at $0.7595.
This bullish thesis could be invalidated if XRP does not break out of this channel within the next 48 hours. Consequently, the cryptocurrency could be exposed to the risk of testing the immediate support level at $0.6235. If XRP falls below this significant price point, then traders may begin to short the altcoin. This could then drag XRP down to as low as $0.5730.
The daily Moving Average Convergence Divergence (MACD) and Relative Strength Index (RSI) indicators suggested that XRP’s price may continue to drop in the next 48 hours. The MACD line was breaking away below the MACD Signal line, which could indicate a continuation of XRP’s negative trend.
Meanwhile, the daily RSI was positioned below the RSI Simple Moving Average (SMA) line. This is normally seen as bearish by traders and suggests that sellers have the upper hand against bulls.
Disclaimer: The information presented in this article is for informational and educational purposes only. The article does not constitute financial advice or advice of any kind. Coin Edition is not responsible for any losses incurred as a result of the utilization of content, products, or services mentioned. Readers are advised to exercise caution before taking any action related to the company.
 Price Prediction 2026, 2027, 2028, 2029, 2030 -2050")


