


- XRP recorded a 0.22% loss over the past 24 hours to trade at $0.4997 at press time.
- The altcoin’s latest price drop led to the formation of a breakout chart pattern on XRP’s daily chart.
- Should bulls identify XRP’s current price as a buying opportunity, the altcoin’s price could rise to as high as $0.5635 soon.
Ripple (XRP) recorded a 0.22% drop in its price over the past 24 hours, according to CoinMarketCap. Subsequently, XRP’s price stood at $0.4997 at press time. Most notably, this latest drop in price added to the negative weekly streak recorded by XRP, which also dragged its price to a key support level that may be identified as a good buy opportunity.
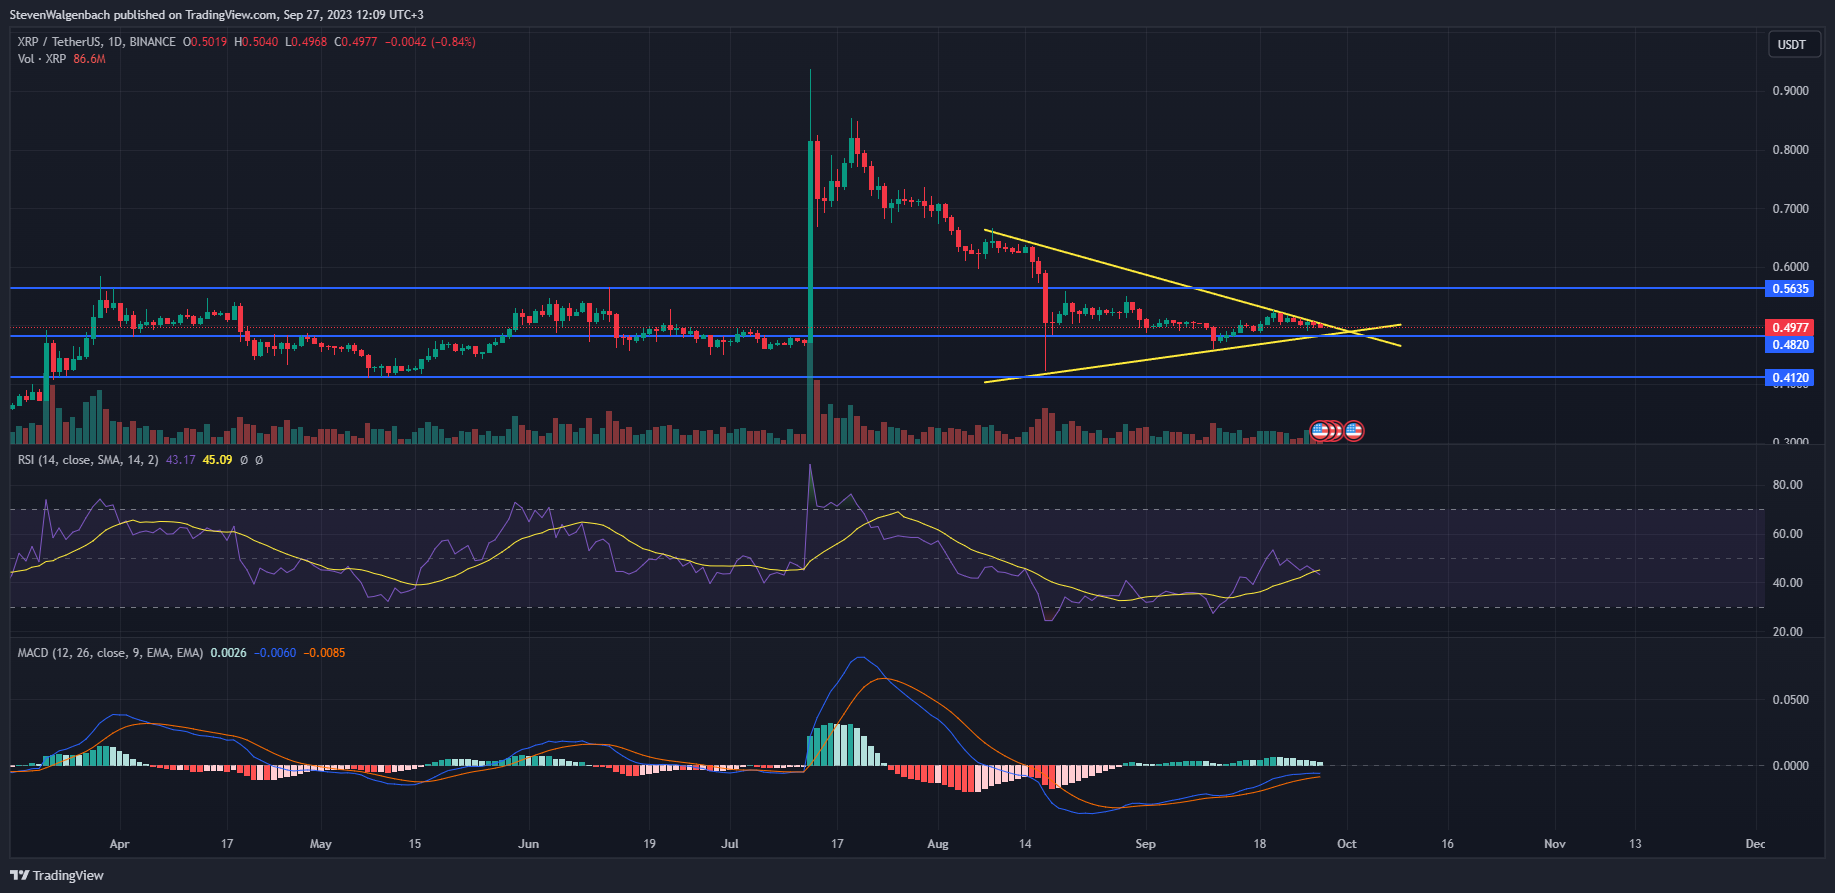
A symmetrical triangle had formed on XRP’s daily chart over the past 2-3 weeks. This specific chart pattern suggests that the altcoin’s price may breakout soon. Meanwhile, the remittance token was trading slightly above the significant support level at $0.4820 at press time.
Consequently, a break below this support level could suggest that a bearish breakout will ensue. As a result, XRP’s price could fall to the next crucial mark at $0.4120. Conversely, a positive breakout may lead to XRP rising to $0.5635 if bulls identify the cryptocurrency’s current price as an opportunity to accumulate.
One thing to note is that technical indicators on XRP’s daily chart supported a bearish outlook at press time. This was mainly due to the fact that a noteworthy technical flag was triggered over the past few days, while another bearish flag was on the cusp of being triggered as well.
Throughout the previous 72 hours, the daily RSI line crossed below the daily RSI SMA line. This particular technical flag suggested that sellers had gained a significant amount of strength on XRP charts recently. Therefore, it may be easier for bears to influence the altcoin’s price and potentially drag it down lower in the coming few days.
Additionally, the MACD line was attempting to cross below the MACD signal line at press time. Should this cross take place between these two technical indicators, it could serve as an indication of XRP’s current bearish trend continuing in the next few days.
Disclaimer: The views and opinions, as well as all the information shared in this price analysis, are published in good faith. Readers must do their own research and due diligence. Any action taken by the reader is strictly at their own risk. Coin Edition and its affiliates will not be held liable for any direct or indirect damage or loss.
Disclaimer: The information presented in this article is for informational and educational purposes only. The article does not constitute financial advice or advice of any kind. Coin Edition is not responsible for any losses incurred as a result of the utilization of content, products, or services mentioned. Readers are advised to exercise caution before taking any action related to the company.


