


- XRP faced resistance at $0.49 but bulls seemed committed to keeping the price above impending decline.
- Accumulation at $0.48 could be the deciding factor for a consistent upward trajectory.
- The ADX might need to stay above 25 unless sellers might take control of the market.
Ripple’s (XRP) performance in June was not something that bulls would have desired. Apart from the few times when the token made an upward movement, XRP consolidated for most of the month.
As a result, it ended the month a little below $0.50. At press time, the token had lost 7.14% of its value in the last 30 days. With Bitcoin (BTC) above $30,000, it means that XRP’s outperformance against the number one cryptocurrency has only been shortlived.
Are These Signs of Recovery?
With July already here, XRP was already attempting to create a bullish market structure. Based on the XRP/USD 4-hour chart, bulls’ dominance at $0.48 was initially shaky but it seemed to have been regained around $0.49.
The previous fallback represents a lack of demand. But the Chaikin Money Flow (CMF) had increased to 0.22 at press time.
Therefore, this oscillation point implies that XRP’s buying strength had improved since the CMF was above 0.20. While there were chances of being overbought, a push down toward a CMF level of 0.20 would indicate XRP could trigger a bullish breakout.
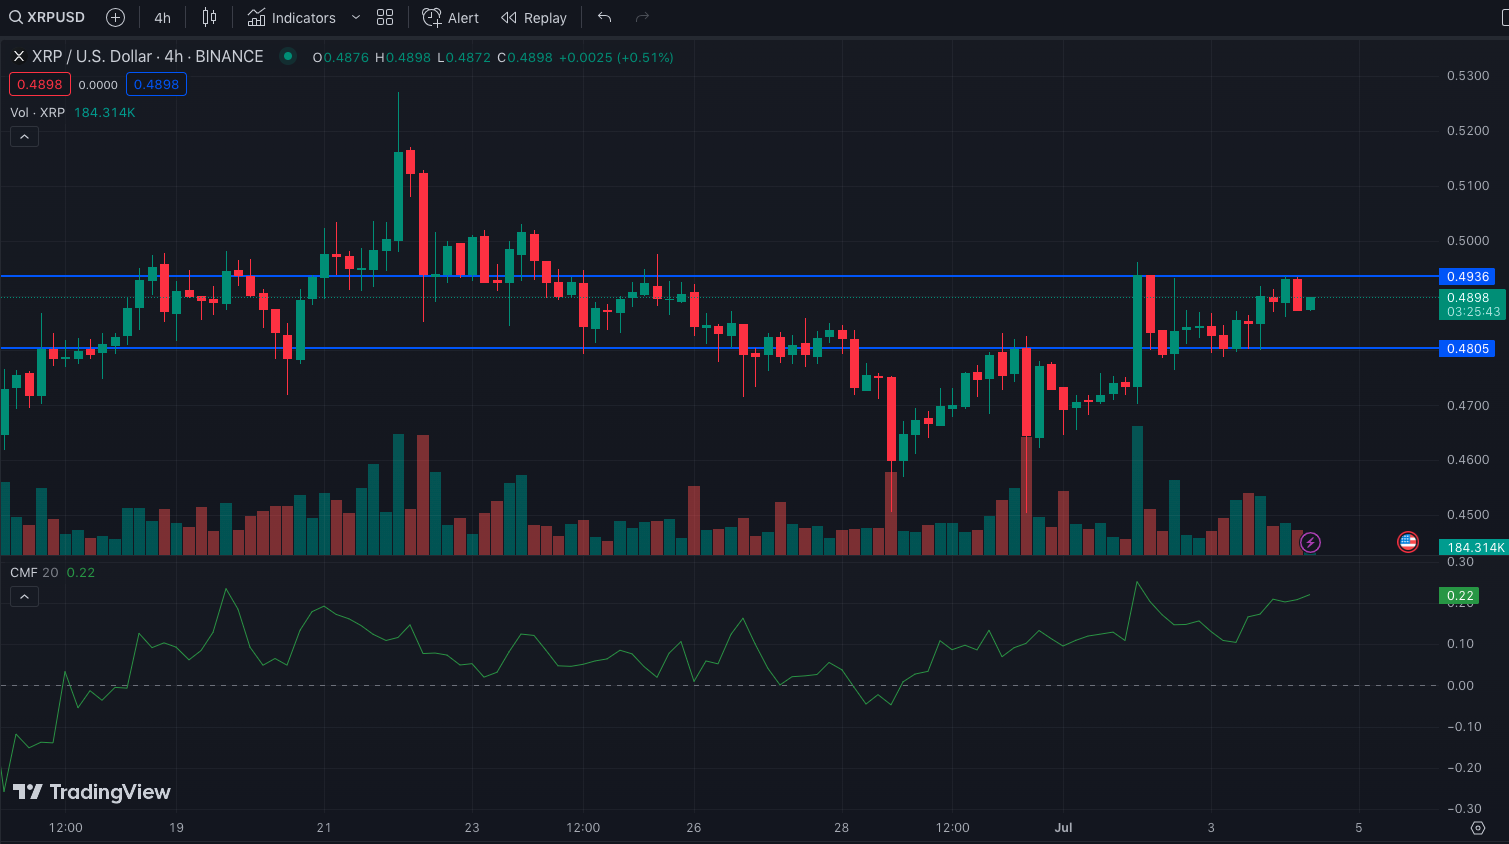
Hence, traders might need to watch the $0.48 region again as an accumulation zone. If demand increases at the said point, XRP’s price action might go parabolic at the expense of bears. However, if selling pressure overtakes bulls’ control then XRP could exchange hands below $0.48.
Subject to Conditions
Furthermore, the Exponential Moving Average (EMA) seemed to support the growth of the token rather than a decline. This was because the 20-day EMA (cyan) had crossed over the 50–day EMA (yellow).
When this happens, it means that the trend could be bullish. Thus, there could be only a little chance that a sell/short trend might override the dominance of buyers. However, this could be subject to the Directional Movement Index (DMI).
At press time, the +DMI (green) WAS 20.66 while the -DMI (red) was 11.34. Again, such a wide margin puts bulls in control, meaning the selling pressure had been neutralized.
Additionally, the Average Directional Index (ADX) was 26.30. Whenever the ADX (purple) is above 25, then it means that the asset has a strong directional movement. So, this was the case with XRP.
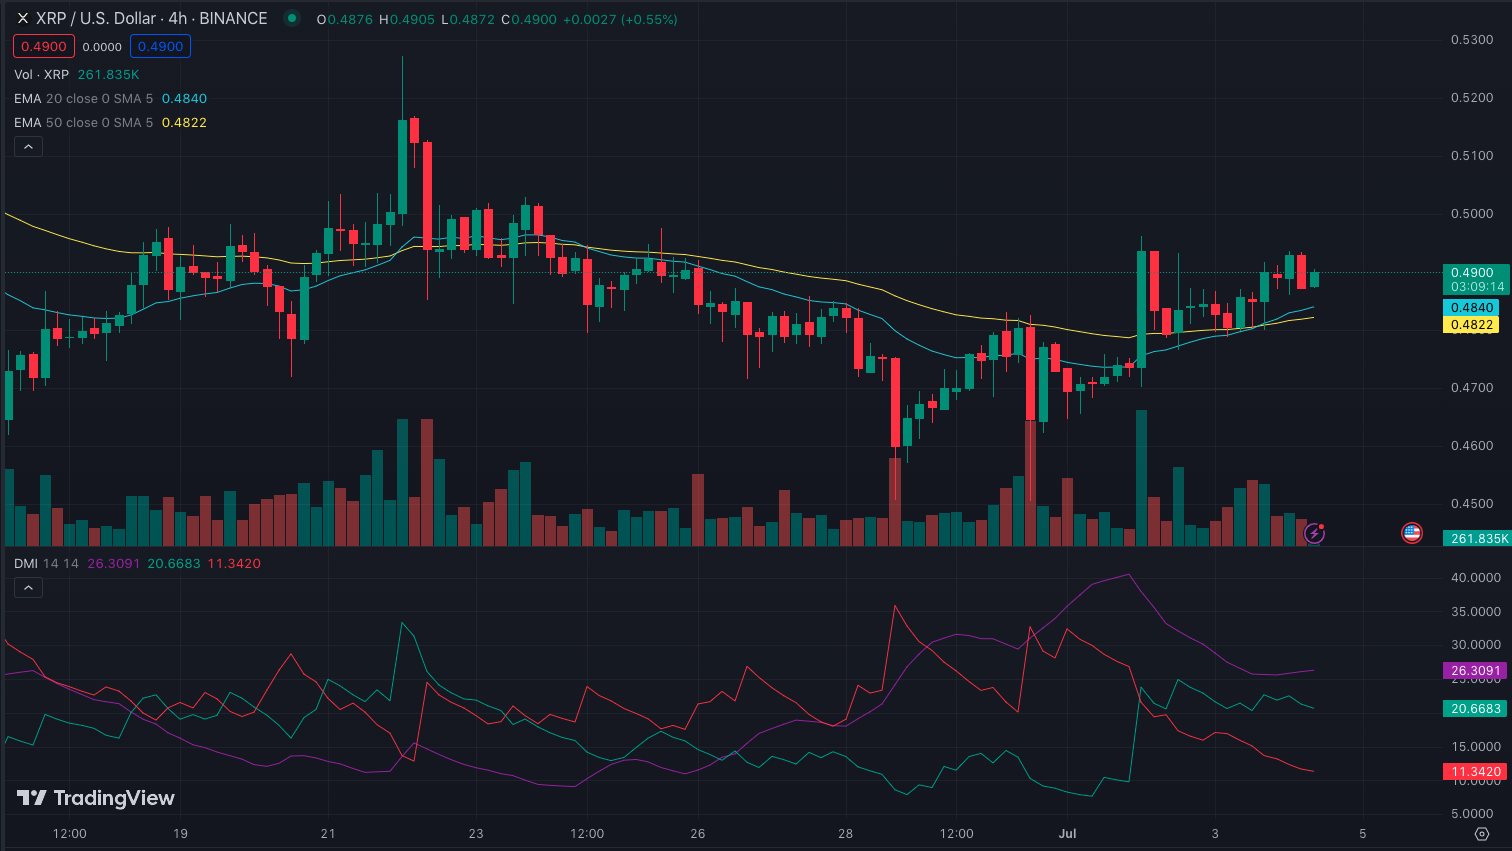
However, for the trend to continue in the upward direction, then the ADX might need to stay above the said level. This would also depend on how well buying pressure would last.
Disclaimer: The views, opinions, and information shared in this price prediction are published in good faith. Readers must do their research and due diligence. Any action taken by the reader is strictly at their own risk. Coin Edition and its affiliates will not be liable for direct or indirect damage or loss.
Disclaimer: The information presented in this article is for informational and educational purposes only. The article does not constitute financial advice or advice of any kind. Coin Edition is not responsible for any losses incurred as a result of the utilization of content, products, or services mentioned. Readers are advised to exercise caution before taking any action related to the company.


