
- Whale XRP inflows to Binance collapsed from 583M tokens to 25.3M, the lowest reading since January 2025 per analyst Darkfost
- S&P Pantera Digital Asset Index launched with ETH, BNB, SOL, Tron, and Hyperliquid as top five holdings, excluding XRP and Bitcoin
- Options volume surged 155.75% to $4.43M as open interest rose 2.09% to $2.52B, signaling traders positioning for a directional move
XRP trades at $1.1300 on July 22, down 1.15%, consolidating between the 0.236 and 0.382 Fibonacci levels as whale selling pressure on Binance reaches its lowest point since January 2025. The S&P Pantera Digital Asset Index launched without XRP this week, drawing community pushback, though the on-chain setup points toward the second stage of a recovery rather than a continuation of the decline.
XRP Price Today: Consolidating in the Right Fibonacci Zone
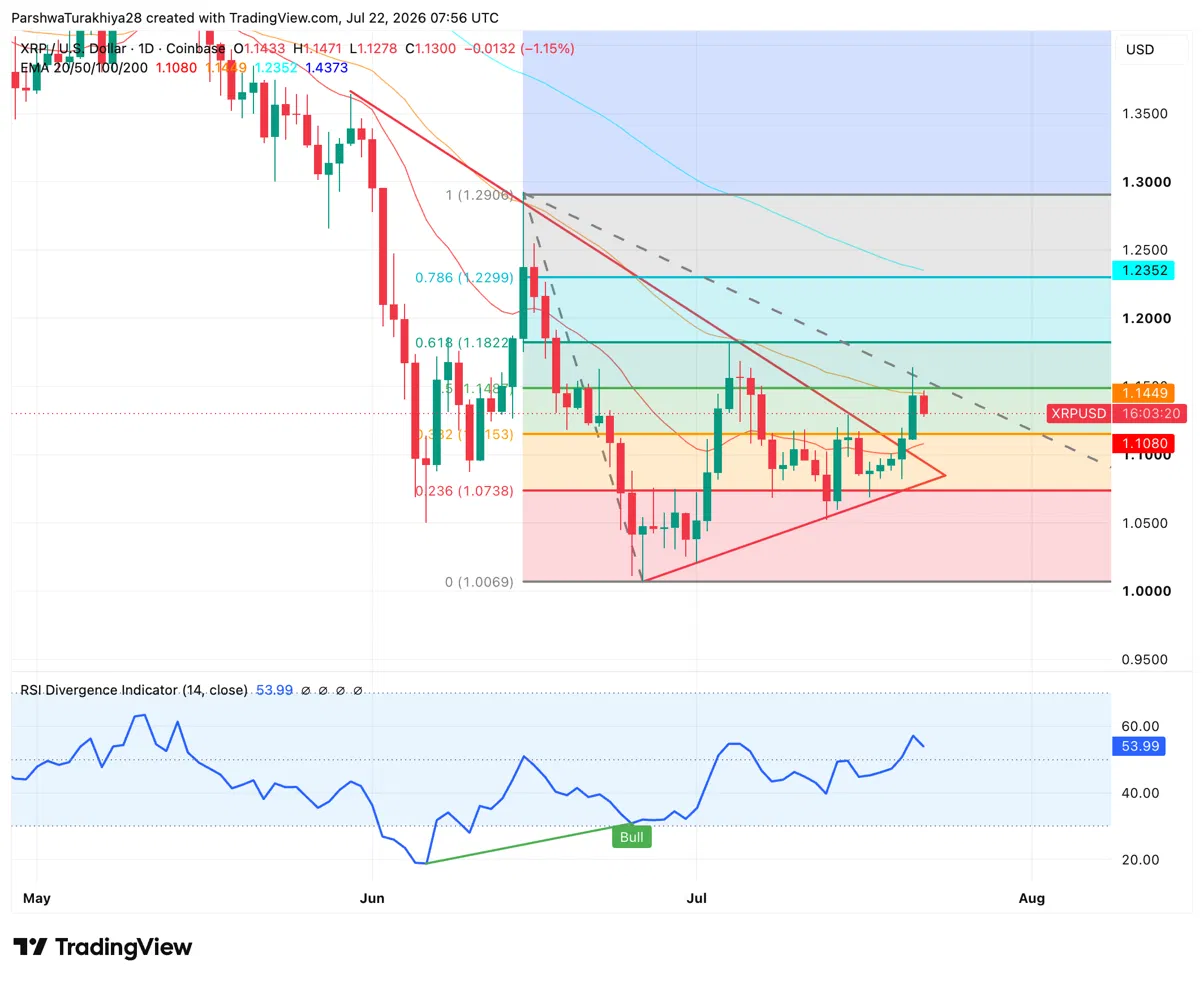
XRP at $1.1300 is holding between the 0.236 Fibonacci at $1.0738 and the 0.382 level at $1.1153, with price sitting above the 20-day EMA at $1.1080 on the current session. The RSI Divergence Indicator at 53.99 has recovered from the bullish divergence that printed in June near the $1.00 low, rising steadily without yet reaching territory that signals overextension. That leaves room for further upside before momentum becomes a concern.
Related: Cardano Price Prediction: Can ADA Break Above $0.18?
The 0.5 Fibonacci at $1.1449 aligns with the 50-day EMA at the same level, forming the first meaningful resistance cluster above. The 0.618 at $1.1822 is the next target, followed by the 0.786 at $1.2299 and the 100-day EMA at $1.2352. A descending trendline from the May peak continues to slope downward through the $1.15 area, adding resistance just above the 0.5 Fibonacci. The $1.0069 June low remains the key floor below.
XRP Support and Resistance Levels — July 22, 2026
| Type | Price | Level |
| Support | $1.1080 | 20-Day EMA (price above this on current session) |
| Support | $1.0738 | 0.236 Fibonacci (lower end of consolidation range) |
| Support | $1.0069 | June low / Fibonacci zero point (key floor) |
| Resistance | $1.1153 | 0.382 Fibonacci (upper end of current range) |
| Resistance | $1.1449 | 0.5 Fibonacci / 50-Day EMA (first cluster above) |
| Resistance | ~$1.15 | Descending trendline from May peak |
| Resistance | $1.1822 | 0.618 Fibonacci (next target on continuation) |
| Resistance | $1.2299 / $1.2352 | 0.786 Fibonacci / 100-Day EMA |
Whale Selling Has Dried Up — Demand Is The Missing Piece
Analyst Darkfost flagged a significant shift in XRP’s on-chain structure. Whale inflows to Binance, which represent large holders moving tokens to the exchange to sell, dropped from a peak of 583M XRP worth approximately $1.36B to just 25.3M XRP worth around $23M.
The 90-day moving average of those inflows fell from $460M in January 2025 to $69M today, confirming the trend rather than just a one-day reading. Darkfost described this as the essential first stage of a recovery cycle: the exhaustion of selling pressure.
Related: Ethereum Price Prediction: $2B ETH Exodus and Record Staking Put $2,000 in Play
The second stage, a return of sustained buying demand, has not arrived yet, but the absence of large sellers removes the primary headwind that kept price pinned near $1 through June.
S&P Pantera Index Launched Without XRP Or Bitcoin
S&P Dow Jones Indices and Pantera Capital launched an 18-token index on July 20 that screens assets by protocol revenue rather than market cap or price momentum. Every constituent delivers a paid service, with the basket generating over $3B in annualized revenue across the trailing two quarters per Pantera. The index is currently a benchmark only, with no ETF tracking launched, though Pantera confirmed discussions with asset managers about potential products are underway.
| Asset | Status | Reason |
| Ethereum (ETH) | Included — Top holding | Largest on-chain economy with extensive DeFi and stablecoin revenue |
| BNB | Included — 2nd largest | Exchange and smart contract ecosystem fees |
| Solana (SOL) | Included — 3rd largest | Transaction settlement fees at scale |
| Tron (TRX) | Included — 4th largest | Stablecoin transfer volume generating consistent protocol fees |
| Hyperliquid (HYPE) | Included — 5th largest | Perpetual futures exchange with direct trading revenue |
| Aave | Included — confirmed | Lending marketplace with tokenholder fee accrual |
| Bitcoin (BTC) | Excluded | No protocol revenue; accessible via single-asset ETFs already |
| XRP | Excluded | XRP Ledger revenue does not accrue to tokenholders under the methodology |
Pantera framed Bitcoin’s exclusion as deliberate rather than punitive, noting institutional allocators can already get direct BTC exposure through single-asset ETFs and the index is designed to sit alongside that allocation. For XRP, the screen is structural: payment volume alone does not satisfy the tokenholder revenue accrual requirement the methodology demands.
Options Activity More Than Doubled As Positioning Builds
| Metric | Value | Signal |
| 24h Volume | $2.32B (+9.04%) | Rising — fresh directional positioning, not rotation |
| Open Interest | $2.52B (+2.09%) | Growing — new positions being opened into the current level |
| Options Volume | $4.43M (+155.75%) | Sharpest single-day jump in recent weeks — traders positioning for a move |
| Long Liquidations (24h) | $890.41K | Longs absorbing most of the session pressure |
| Short Liquidations (24h) | $1.96M | Shorts losing more despite XRP being down 1.15% on the day |
| Top Trader L/S (Accounts) | 2.87 | Large accounts firmly net long |
| Top Trader L/S (Positions) | 1.69 | Position sizing also net long heading into CLARITY Act window |
Options volume surging 155.75% on a day where spot price moved less than 1.5% is a forward-looking signal. Options buyers are not trading the current range — they are positioning for a future directional move. The combination of rising spot volume, rising open interest, and a sharp options surge all on the same session points to a market that is building rather than distributing.
XRP Price Prediction: Upside and Downside Targets
- Upside case: Whale selling exhaustion transitions into fresh demand, XRP clears the 0.5 Fibonacci and 50-day EMA cluster at $1.1449, and CLARITY Act progress before August 7 drives a move toward the 0.618 at $1.1822 and the 100-day EMA at $1.2352.
- Downside case: The S&P exclusion narrative and broader macro caution ahead of the July 29 FOMC meeting weigh on sentiment, XRP slips below the 20-day EMA at $1.1080, and price retests the 0.236 Fibonacci at $1.0738 as the demand stage Darkfost described fails to materialize before the August recess.
Related: Ondo Price Prediction: Can Buyers Push Beyond $0.4107 for the Next Rally?
Disclaimer: The information presented in this article is for informational and educational purposes only. The article does not constitute financial advice or advice of any kind. Coin Edition is not responsible for any losses incurred as a result of the utilization of content, products, or services mentioned. Readers are advised to exercise caution before taking any action related to the company.