


- XRP spot ETFs saw two consecutive daily outflows, the first back-to-back since March 9-10
- Spot exchange netflow flipped positive at $3.31M on July 2, signaling accumulation
- Options volume jumped 129.40% as traders position for a directional move near $1.00
XRP trades at $1.0623 on July 2, up 0.99% after bouncing off the $1.0438 low, as US spot ETFs posted back-to-back daily outflows for the first time since March, even as the ninth consecutive week of net inflows remains intact.
Is XRP Losing Ground Below Its Supertrend Line?
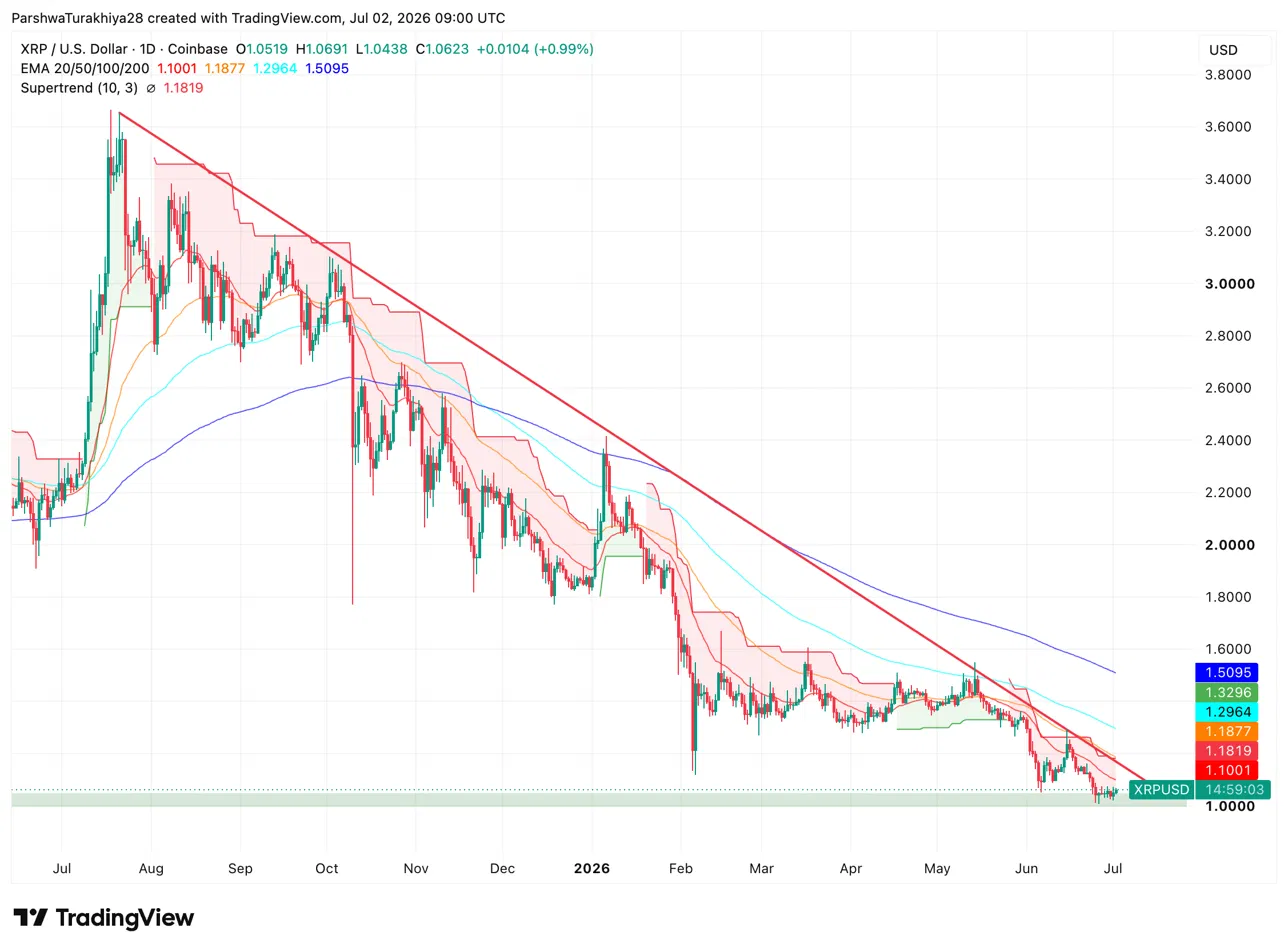
The daily chart shows XRP still caught below its Supertrend (10,3) at $1.1819, with the 20-day EMA at $1.1001 acting as the first wall to clear. The 50-day sits at $1.1877, the 100-day at $1.2964 and the 200-day at $1.5095, all descending and stacked above price. A steep red descending trendline from the August 2025 highs near $3.60 continues to compress every bounce attempt, with price now wedged between the $1.00 support floor below and that trendline above.
Related: Bitcoin Price Prediction: BTC Stabilizes Near $60K as Metaplanet Adds 2,823 BTC to Treasury
Price has held the horizontal support band near $1.00-$1.05 for nearly two weeks without breaking lower, forming a tentative base even as the broader trend remains bearish.
What Are The Key Support And Resistance Levels For XRP Today?
- Support at $1.0438 and the $1.00 psychological floor
- Resistance at $1.1001 on the 20-day EMA, then $1.1819 on the Supertrend
Did XRP’s ETF Inflow Streak Just Break?
US spot XRP ETFs recorded a $1.86M daily outflow on July 1, following a $2.83M outflow on June 30, marking two consecutive days of net selling for the first time since March 9-10. Bitwise’s XRP fund drove most of the damage with a $4.75M single-day outflow, partially offset by Franklin’s XRPZ adding $2.88M.
Related: Cardano Price Prediction: ADA Shorts Getting Wrecked As Whale Holdings Hit All-Time High
The weekly picture remains intact. Cumulative net inflows still sit at $1.48B, and the ninth consecutive week of positive weekly flow hasn’t been broken yet, with July 2’s spot netflow of $3.31M moving to the positive side. Two back-to-back daily outflows matter as a signal to watch, but the last time this happened in March it preceded a strong recovery week rather than sustained selling.
What Do XRP Derivatives Reveal About Current Positioning?
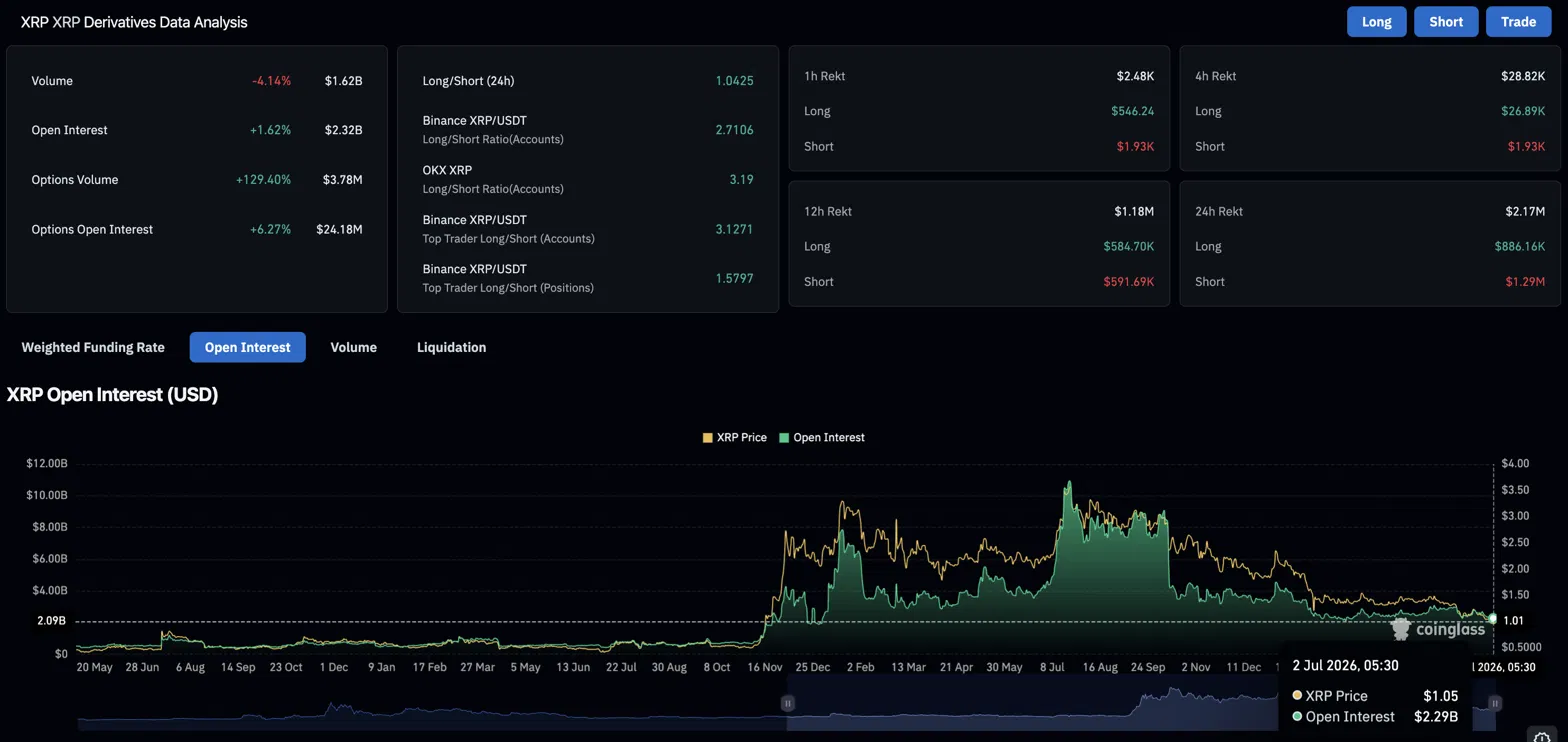
Volume fell 4.14% to $1.62B while open interest rose 1.62% to $2.32B, a split that points to traders adding positions at a slower pace rather than exiting. Options volume surged 129.40% to $3.78M, the largest jump in the derivatives data, showing traders are hedging or speculating on a near-term move using options rather than perpetuals.
Liquidations over 24 hours hit $2.17M, with shorts taking the larger hit at $1.29M against $886.16K for longs. Over 12 hours the balance was nearly even at $591.69K shorts versus $584.70K longs, suggesting neither side has clear control at current levels.
XRP Price Prediction: Upside and Downside Targets
Upside case: The weekly ETF streak holds, spot accumulation continues, and XRP clears $1.1001 on its way to a Supertrend retest near $1.1819.
Downside case: Back-to-back ETF outflows extend to a third day, $1.00 breaks on renewed macro pressure, and XRP slides toward $0.90.
Disclaimer: The information presented in this article is for informational and educational purposes only. The article does not constitute financial advice or advice of any kind. Coin Edition is not responsible for any losses incurred as a result of the utilization of content, products, or services mentioned. Readers are advised to exercise caution before taking any action related to the company.


