





- XRP price prediction stays bearish below $1.34, the 100-day EMA, with $1.2827 as first support.
- US spot XRP ETFs lost $2.47M on October 16, their second straight day of outflows.
- Ripple CEO Brad Garlinghouse says XRP already has legal clarity even with the CLARITY Act stalled.
XRP price prediction for next week and the rest of October stays bearish below $1.34, the level XRP needs to reclaim after slipping under its rising trendline.
XRP Price Analysis: Can XRP Win Back $1.34 After Losing Its Trendline?
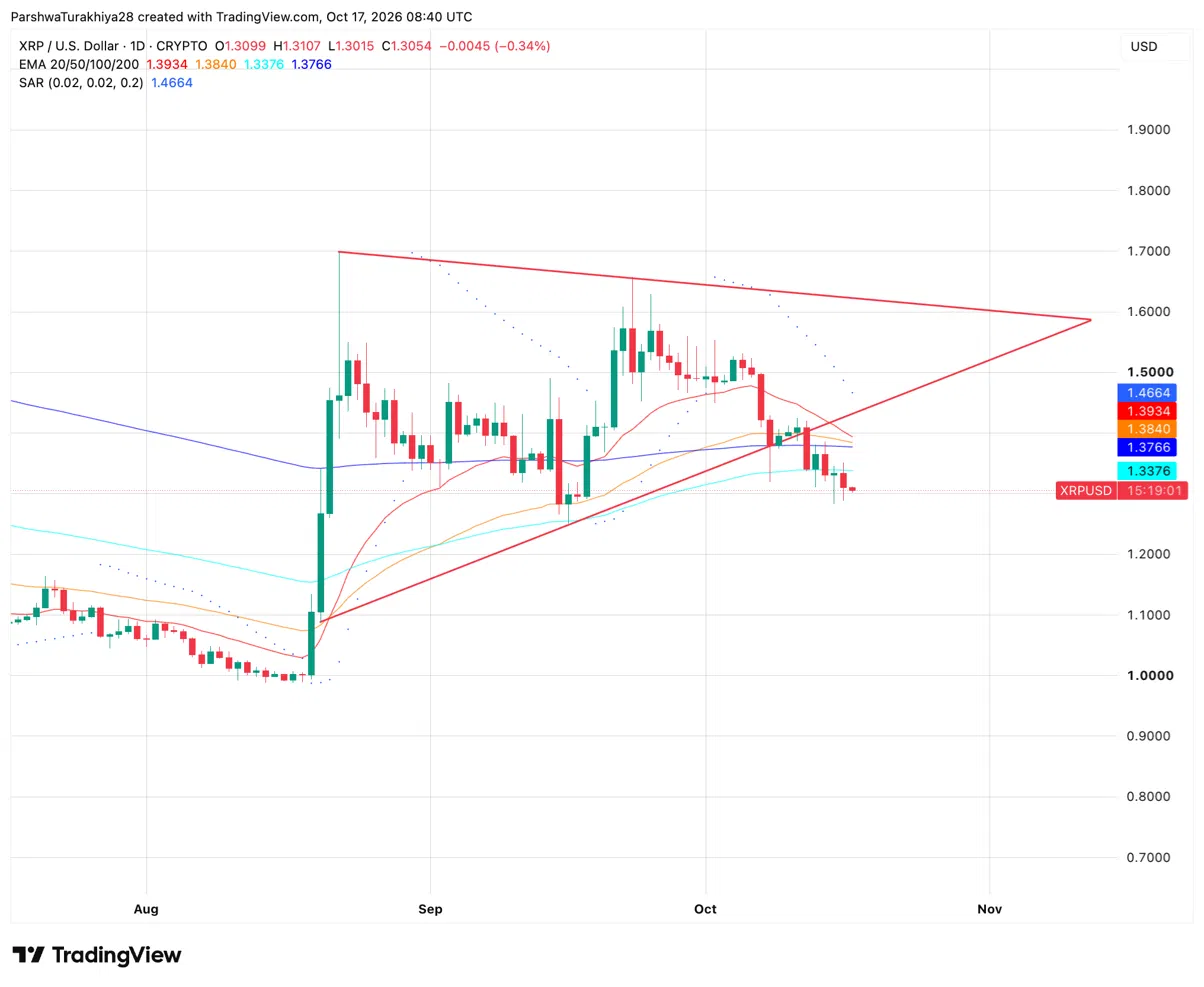
XRP needs a daily close above $1.34, the 100-day EMA, to start recovering, because price at $1.3054 trades below all four daily averages and below the rising trendline it lost earlier this month.
That line and the descending one from the late-August high had formed a narrowing triangle, and price has now exited it from the bottom.
The averages sit stacked above price at $1.34 (100-day), $1.3766 (200-day), $1.3840 (50-day) and $1.3934 (20-day), and the Parabolic SAR at $1.47 also remains above price. This week’s low of $1.2827 is the nearest support.
XRP Weekly Chart Analysis: Can XRP Hold Above $1.24?
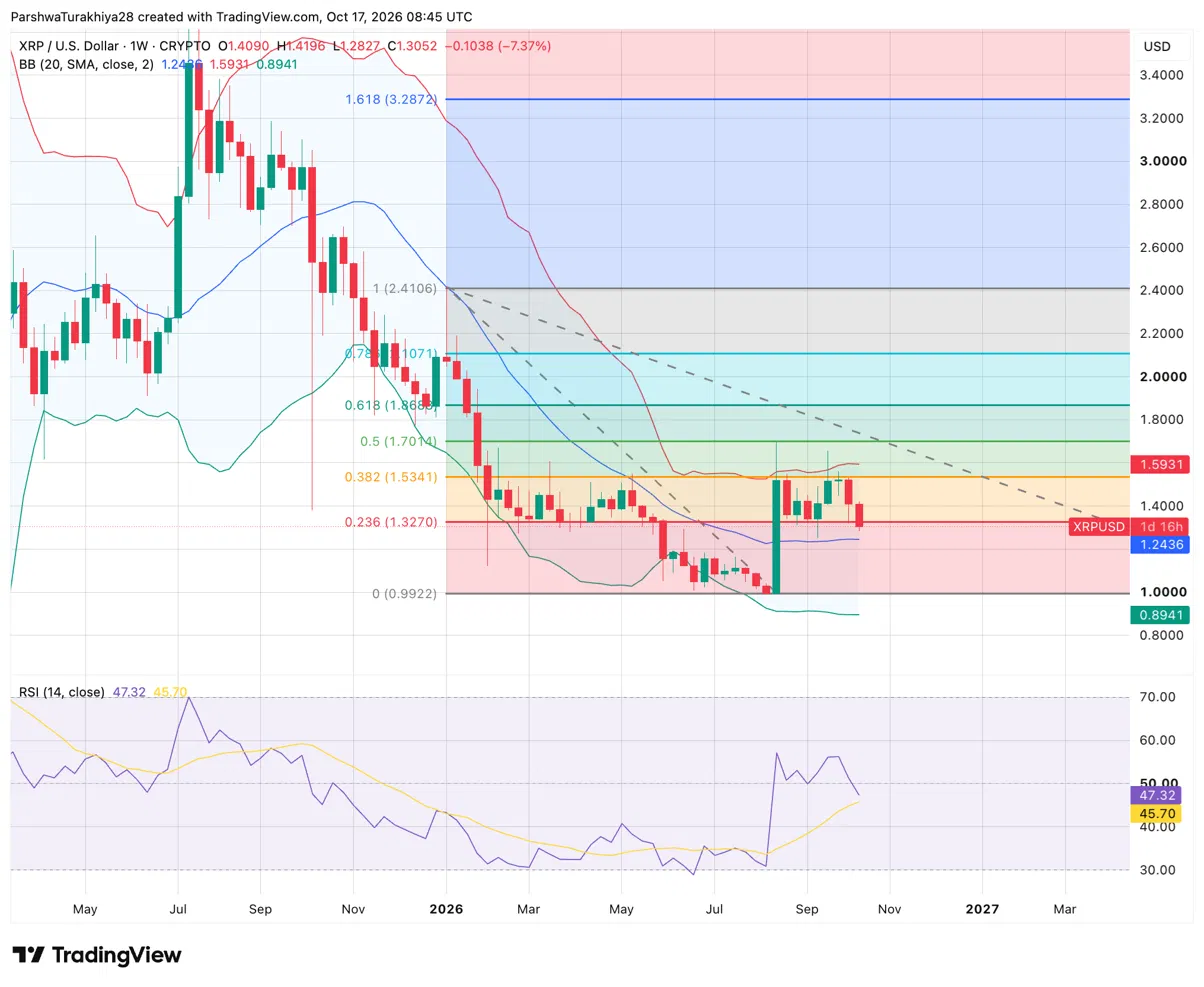
XRP is holding above the weekly Bollinger Band midline at $1.24 for now, but it has lost the 0.236 Fibonacci level at $1.33, the floor it kept for most of the weeks since August. Price at $1.31 is down 7.5% on the week, which leaves the midline as the next test. Weekly RSI at 47.32 sits below the neutral 50 mark and is nearing its average of 45.70, so momentum is still fading rather than recovering.
XRP looks more likely to test $1.24 than to reclaim $1.33 next week, and a weekly close below the midline would open the way to the August low at $0.99.
XRP Support and Resistance Levels, October 17, 2026
| Type | Price | Why it matters |
| Resistance | $1.33 | Weekly 0.236 Fibonacci level |
| Resistance | $1.34 | 100-day EMA |
| Resistance | $1.39 | 20-day EMA |
| Support | $1.28 | This week’s low |
| Support | $1.24 | Weekly Bollinger Band midline |
| Support | $0.9922 | Fibonacci 0 level, August low |
Ripple CEO Brad Garlinghouse Says XRP Already Has Legal Clarity
Ripple CEO Brad Garlinghouse said on Thursday that XRP already has the legal footing it needs, even though the CLARITY Act has stalled in the Senate.
Speaking at Nasdaq in remarks covered by Talking Tokens, he pointed to a federal judge’s ruling that XRP is not a security and argued that SEC and CFTC rulemaking will keep regulation moving without the bill. “You can’t put the genie back in the bottle,” he said.
The comments came as Evernorth, listed on Nasdaq as XRPN, rang the exchange’s closing bell this week.
BankXRP Flags Taker Buy Spikes as XRP Dipped Toward $1.30
BankXRP said in a post on X that taker buy volume, which tracks buy orders filled immediately at the market price, spiked across Binance, Bybit and OKX. The largest surge came as XRP dipped toward $1.30, followed by a sharp recovery toward $1.34.
BankXRP asked whether this was aggressive buying or a short-term reaction and gave no volume figures, so the post does not settle the question.
XRP ETFs Snap a 13-Week Inflow Streak
US spot XRP ETFs recorded a net outflow of $1.84M for the week ending October 16, ending 13 straight weeks of inflows that had brought in more than $300M according to SoSoValue. Most of the loss came on October 16, when the funds shed $2.47M, all of it from Canary’s XRPC, after a $104.51K outflow on October 15 and a $740.41K inflow on October 14.
| ETF Metric | Value |
| Weekly net flow, week ending Oct 16 | -$1.84M |
| Weekly net flow, week ending Oct 9 | +$11.31M |
| Daily net flow, Oct 16 | -$2.47M |
| Cumulative net inflow | $1.80B |
| Total net assets | $1.47B |
XRP Price Prediction: Bullish and Bearish Scenarios for Next Week and October-End
Bullish Case, Target: $1.47
XRP closes back above the 0.236 Fibonacci level at $1.3270 and the 100-day EMA at $1.3376, then clears the averages up to the 20-day at $1.3934. That would put the Parabolic SAR at $1.4666 in play, and a move through it would turn the short-term trend. BankXRP’s taker buy spikes would fit this path if the buying near $1.30 carries into next week.
Bearish Case, Risk Level: $1.24 (Weekly Bollinger Band Midline)
XRP stays below $1.3376, loses this week’s low at $1.2827 and slides toward the weekly Bollinger Band midline at $1.2436. A weekly close below that level would bring the August low at $0.9922 into view, and continued ETF outflows alongside weekly RSI falling below its average at 45.70 would fit that path.
XRP Price Prediction FAQs
XRP could rebound toward $1.3934 and then $1.4666 if it reclaims the 100-day EMA at $1.3376. Losing this week’s low at $1.2827 risks a slide toward the weekly Bollinger Band midline at $1.2436.
XRP trades at $1.3054, below its 20-day EMA at $1.3934, 50-day at $1.3840, 100-day at $1.3376 and 200-day at $1.3766, and under its broken rising trendline.
US spot XRP ETFs lost $2.47M on October 16 and $104.51K the day before, according to SoSoValue, after taking in $740.41K on October 14. Cumulative net inflows stand at $1.80B.
Ripple CEO Brad Garlinghouse said on Thursday that a federal judge’s ruling that XRP is not a security gives the token the legal footing it needs, even with the CLARITY Act stalled in the Senate.
Disclaimer: The information presented in this article is for informational and educational purposes only. The article does not constitute financial advice or advice of any kind. Coin Edition is not responsible for any losses incurred as a result of the utilization of content, products, or services mentioned. Readers are advised to exercise caution before taking any action related to the company.




