
- XRP price analysis indicates the altcoin has been on a bullish trend in the last 24 hours
- However, the bullish momentum has started fading as XRP is testing the support level of $0.380
- A bearish breakout might cause the price to fall to $0.353, which is the next support level.
Ripple price action in the hourly and 2-hour timeframe indicates the recent trading session has seen a bearish wedge pattern form on the Ripples (XRP/USD) charts, signaling a potential bearish breakout. Over the last 24 hours, XRP has been trending upwards, however, bulls seem to be running out of steam as the price drops toward a key support level.
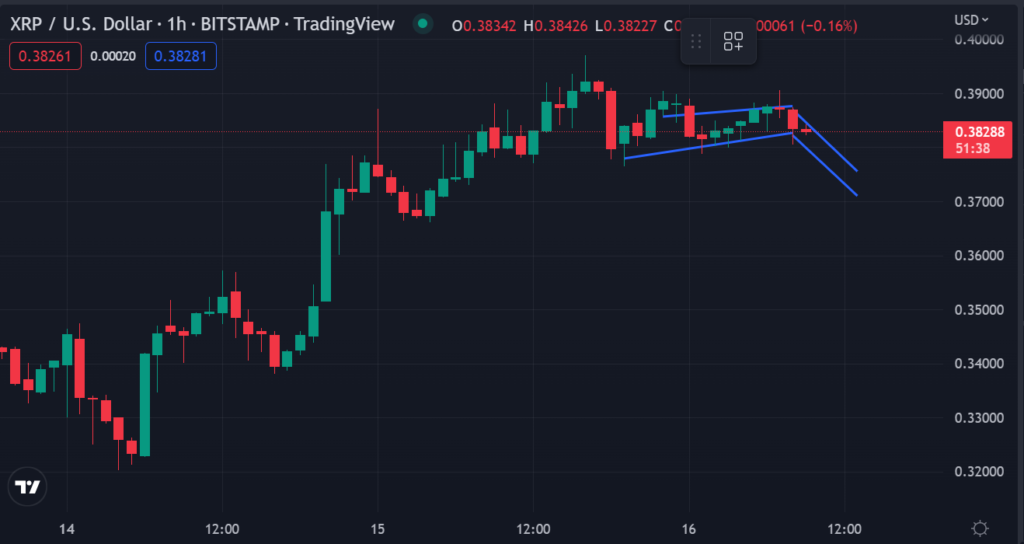
XRP price has been inching downwards over the last 2 hours after failing to break past the resistance at $0.396. However, XRP is still trading above its 50-hour moving average (MA) and 100-hour MA, which are both trending upwards. This suggests that the uptrend is still intact, but the bullish momentum has started to grow weaker as the asset inches toward a key support level.
XRP price is trading near support levels as the XRP/USD chart shows that bulls are struggling to hold on to their upward momentum, while bears are starting to show signs of life in this short-term timeframe. The price of XRP has dropped from resistance at $0.396 to its current level, where it is hovering around the support at $0.380.
A sustained drop below the $0.380 support would cause Ripple’s price to fall further toward the next key support level at $0.353. At the time of writing, XRP was trading at $0.383 according to data from CoinMarketCap.
Technical indicators suggest bullish momentum is starting to fade as Ripple’s 2-hour Stochastic RSI oscillator is currently deep in overbought territory, while the daily and 4-hour oscillators continue to move higher. Meanwhile, the hourly chart’s MACD is treading lower, indicating that bearish momentum is gaining traction.
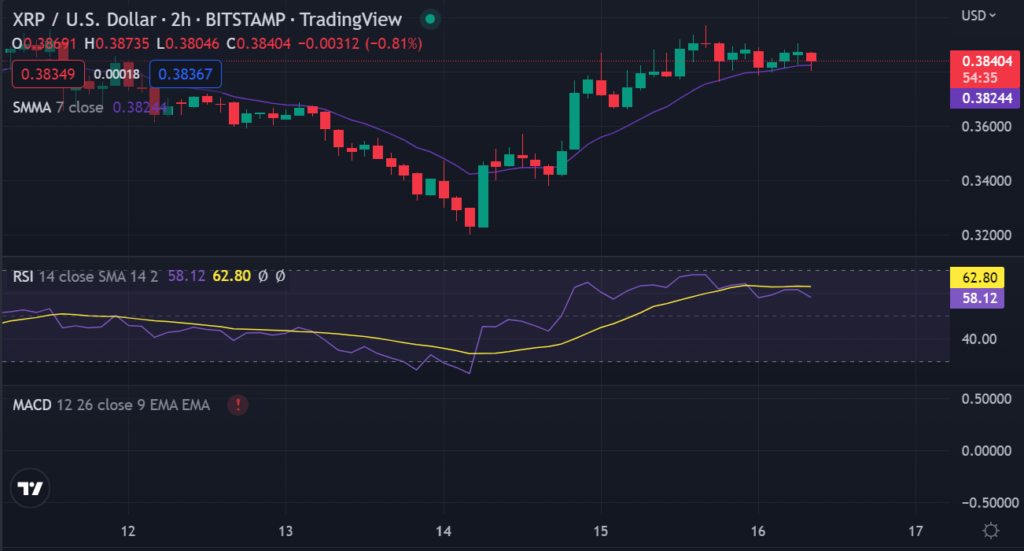
Further technical indications indicate the Exponential Moving average lines which measure the short-term, mid-term, and long-term price movements of XRP/USD are moving toward convergence, which could signal that the bulls’ strength is waning.
The 100 SMA is below the longer-term 200 SMA to indicate that the path of least resistance is to the downside or that sellers are more likely to take control from here. This also means that support at $0.38 might be stronger than anticipated since the moving averages are holding as dynamic inflection points.
In addition to the wedge pattern, an overbought signal on the hourly and 4hour relative strength index is also visible. This means that a dip to support could draw more buyers back in, so the price might be able to maintain this area for now.
Ultimately, Ripple’s price action in the hourly and 2-hour timeframe suggests that bears might take control as they appear to be starting to regain their strength against a weakening bull run. This might be a good time for investors to keep an eye out for the potential bearish breakout and start preparing for the next support level at $0.353, but bulls should still hold on above the $0.380 mark as it could provide them with a chance of regaining their ground in this short-term timeframe.
In conclusion, Ripple price action in the short term indicates that a bearish wedge pattern has formed on the charts. If bulls fail to hold onto support at $0.380, XRP’s price will likely drop further toward the next support level at $0.353. Otherwise, Ripple’s price could continue to trade sideways for the time being.
Disclaimer: The views and opinions, as well as all the information shared in this price prediction, are published in good faith. Readers must do their research and due diligence. Any action taken by the reader is strictly at their own risk. Coin Edition and its affiliates will not be held liable for any direct or indirect damage or loss.
Disclaimer: The information presented in this article is for informational and educational purposes only. The article does not constitute financial advice or advice of any kind. Coin Edition is not responsible for any losses incurred as a result of the utilization of content, products, or services mentioned. Readers are advised to exercise caution before taking any action related to the company.
")


