


- XRP’s daily chart showed that it had bounced off the lower lows and could trend higher.
- A successful close above $0.55 could trigger a 22.85% rally toward $0.70.
- The 4-hour and daily chart indicated that rejection at $0.55 could force a plunge to $0.50.
Ripple’s (XRP) price action on the daily timeframe suggested that the token could break out soon. Between December 6 and February 14, XRP formed a descending parallel channel. During this period, the support line connected consecutive lower lows while the resistance linked consecutive lower highs.
However, the price had since bounced off the support trend line at $0.50. Despite the upswing, XRP faced another hurdle at $0.55. Previous attempts to flip the zone had been met with rejection.
XRP/USD Daily Analysis
If bulls successfully breach the resistance, XRP triggers a 22.85% rally which could help the price retest $0.70. Conversely, another failed attempt at flipping $0.55 could lead the price downward. Should this be the case, XRP’s value might shrink by 7.40%, bringing the price back to $0.50.
At press time, the Relative Strength Index (RSI) reading was 52.40, indicating that bulls had the upper hand. If bulls maintain this position or the RSI trends higher, then XRP could break out and hit $0.59 for a start.
While the RSI climbed, the Awesome Oscillator (AO) had yet to exit the red histogram bars. A situation like this suggests that buyers had not completely neutralized sellers.
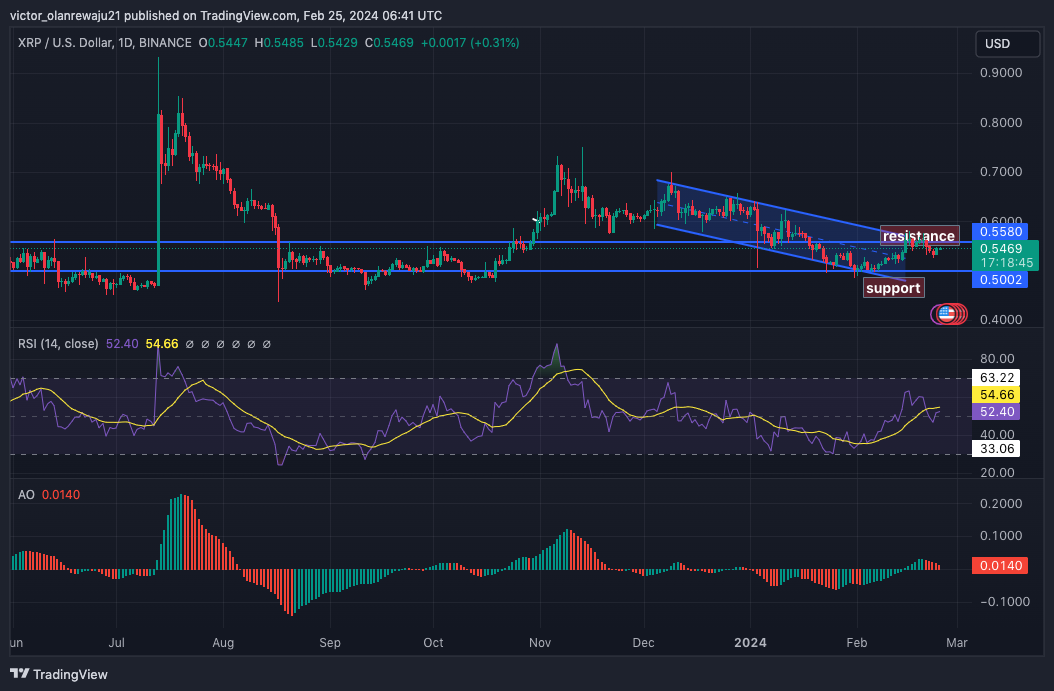
If the AO reading plunges into the negative region, it would indicate increasing downward momentum, and this could stop XRP’s potential upswing. On the other hand, if the histogram bars change to green, XRP’s bullish prediction could be validated.
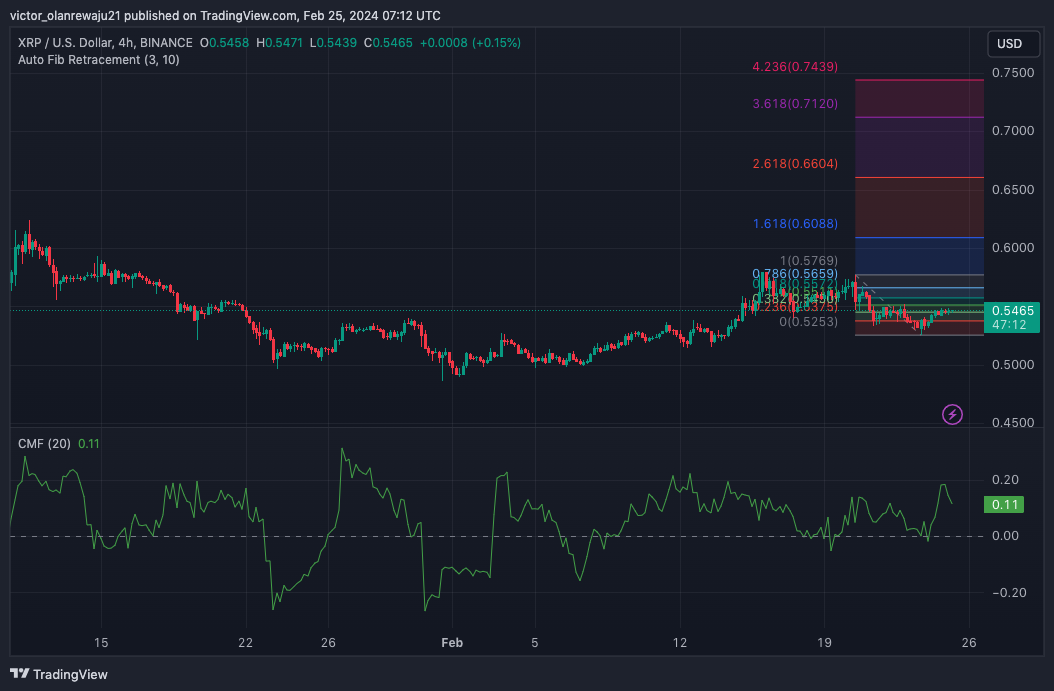
XRP/USD 4-Hour Analysis
Meanwhile, the 4-hour XRP/USD chart aligned with the optimistic forecast. For instance, the 02.36 Auto Fibonacci retracement indicator was positioned at $0.54. This suggested that XRP might have reached its short-term pullback point.
On the upside, Coin Edition noticed that the 4.236 Fib level was at $0.74. The possible inference implied that the price could extend to ward $0.74 in a highly bullish condition. However, if the broader market sentiment becomes bearish, XRP might not slide as low as $0.50.
In addition, the Chaikin Money Flow (CMF) was 0.11. The CMF measures buying and selling pressure. Therefore, being in the positive territory indicates buying pressure for the token. For the underlying price, this reading could foreshadow a higher price.
Going forward, technical indicators might not be the sole determinant of XRP’s price. Another factor that could influence its value is the ongoing lawsuit Ripple has with the U.S. SEC. If Ripple edges over the regulator, then XRP might rally. But if it is the other way around, the price could stall or plummet.
Disclaimer: The information presented in this article is for informational and educational purposes only. The article does not constitute financial advice or advice of any kind. Coin Edition is not responsible for any losses incurred as a result of the utilization of content, products, or services mentioned. Readers are advised to exercise caution before taking any action related to the company.
Disclaimer: The information presented in this article is for informational and educational purposes only. The article does not constitute financial advice or advice of any kind. Coin Edition is not responsible for any losses incurred as a result of the utilization of content, products, or services mentioned. Readers are advised to exercise caution before taking any action related to the company.


