






- YFI breaks above major EMAs as bullish momentum drives a strong weekly recovery.
- Open interest remains muted despite rally, signaling cautious trader participation.
- Persistent spot outflows may limit upside unless fresh buying demand strengthens.
Yearn Finance (YFI) has regained market attention after delivering one of its strongest daily advances in recent months. The token climbed more than 16% within 24 hours and extended its weekly gains above 40%, signaling renewed buying interest across the market.
The sharp rally pushed YFI above several important technical levels, shifting market sentiment toward a more optimistic outlook. However, traders continue to monitor whether buyers can sustain this momentum, especially as derivatives activity and spot market flows still present mixed signals despite the impressive price recovery.
Technical Breakout Strengthens Bullish Outlook
YFI currently trades around $2,316 after surging from nearly $1,600 during a powerful breakout. Significantly, the move carried the token above its 20-day, 50-day, and 100-day exponential moving averages. That development suggests buyers have regained short-term control after weeks of sustained weakness.
Additionally, the price reclaimed the 0.618 Fibonacci retracement near $2,330. That level now serves as immediate support following the breakout. Holding above this area could strengthen confidence and encourage another wave of buying activity.
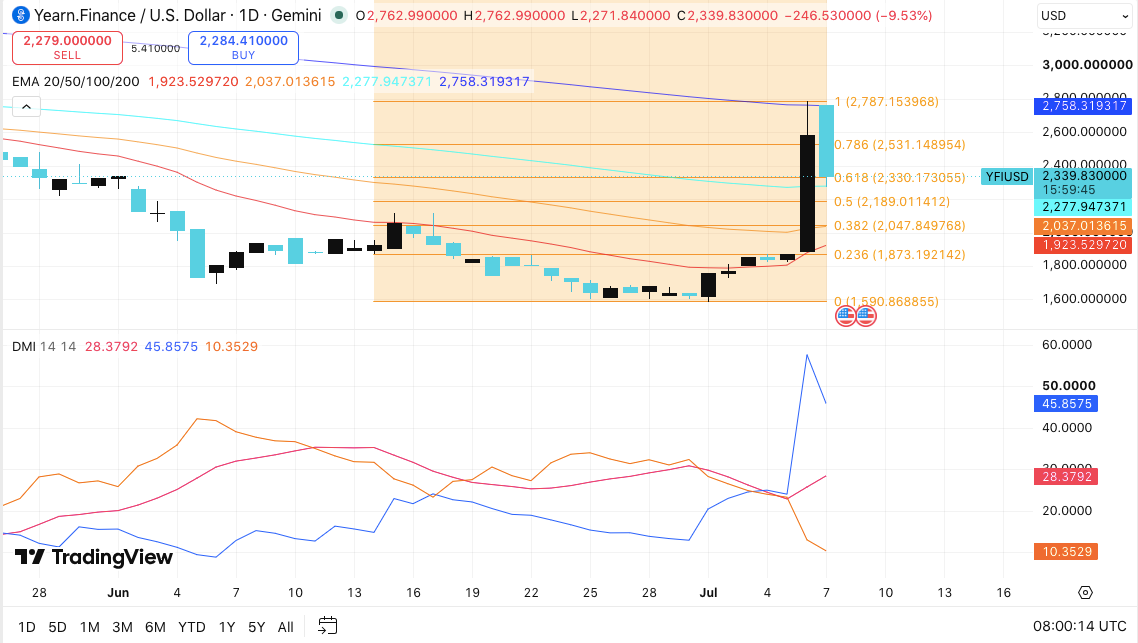
Momentum indicators also support the improving outlook. The positive Directional Indicator has moved well above the negative indicator. Meanwhile, the Average Directional Index continues rising, showing that the current trend has gained strength instead of fading quickly.
Related: Cardano Price Prediction: Can ADA Hold the 50-Day EMA After Adding 15,000 Wallets in Two Weeks?
Consequently, a successful move above $2,531 could open the path toward the next resistance region between $2,760 and $2,790. However, traders may first witness a healthy pullback toward $2,330 or the 100-day EMA before another upward attempt.
Open Interest Signals Cautious Optimism
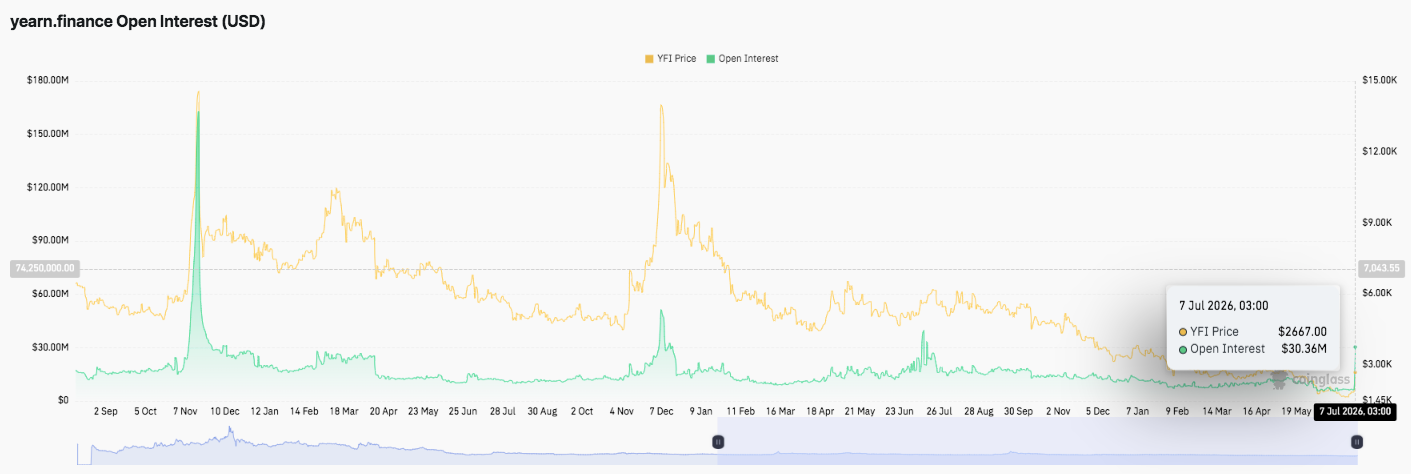
Despite the price surge, derivatives traders remain relatively cautious. Open interest has stabilized near $30.36 million after months of steady declines. Previous rallies triggered temporary spikes in leveraged positions, yet those gains quickly disappeared as traders exited the market.
Moreover, the current recovery lacks strong confirmation from the futures market. Rising prices without expanding open interest often indicate limited participation from leveraged investors. Therefore, analysts may seek stronger growth in open interest before confirming a sustained bullish trend.
Spot Flows Continue to Reflect Selling Pressure
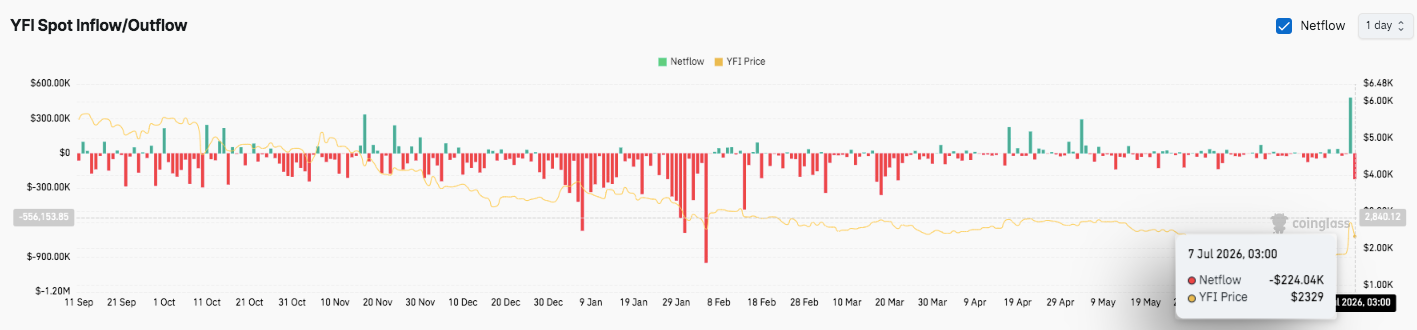
Spot market activity presents another challenge for the rally. Netflow data continues showing persistent outflows, suggesting many investors still reduce their YFI holdings despite improving prices. Recent outflows, including roughly $224,000 on July 7, reinforce that cautious sentiment.
Related: Blur Price Prediction: Bulls Target Breakout Above $0.0223 After 38% Rally
Besides, previous inflow spikes failed to establish lasting accumulation during earlier recovery attempts. Consequently, stronger spot demand would likely improve confidence and support higher price targets.
Technical Outlook for Yearn Finance (YFI)
Key levels remain in focus as Yearn Finance attempts to extend its breakout after reclaiming several major moving averages.
Upside levels: $2,531 stands as the immediate resistance. A confirmed breakout above this level could drive YFI toward the $2,760–$2,790 zone, where the 200-day EMA and the 1.0 Fibonacci extension converge. Clearing this area would strengthen the medium-term bullish structure and expose higher recovery targets.
Downside levels: Initial support sits at $2,330, the 0.618 Fibonacci retracement that recently flipped into support. Below that, the 100-day EMA at $2,278 offers the next defense, followed by the 50-day EMA at $2,037 and the 20-day EMA at $1,923 if selling pressure intensifies.
Resistance ceiling: The $2,760–$2,790 region remains the most significant barrier. A decisive daily close above this zone would confirm a broader trend reversal and attract stronger buying interest.
The technical picture favors the bulls after YFI broke above multiple moving averages in a single session. Moreover, the rising ADX and widening gap between the positive and negative DMI lines indicate strengthening trend momentum rather than a short-lived price spike.
Will Yearn Finance Go Up?
Yearn Finance’s next move depends on whether buyers can defend the $2,330 support while attracting fresh participation from both spot and derivatives markets. A sustained rise in open interest alongside improving spot inflows would strengthen the case for another rally toward $2,531 and eventually the $2,760–$2,790 resistance zone.
Related: Solana Price Prediction: Can SOL Hold the 100-Day EMA After Its Busiest Week on Record?
However, if momentum weakens and YFI loses $2,330, a pullback toward $2,278 or even $2,037 could follow before buyers attempt another recovery. For now, the broader technical structure has shifted in favor of the bulls, but stronger market participation will determine whether this breakout develops into a sustained uptrend.
Disclaimer: The information presented in this article is for informational and educational purposes only. The article does not constitute financial advice or advice of any kind. Coin Edition is not responsible for any losses incurred as a result of the utilization of content, products, or services mentioned. Readers are advised to exercise caution before taking any action related to the company.




