


- YFI is up 3.49% in the last 24 hours and it is trading at $6,478, as per CoinMarketCap.
- YFI 7-day chart shows the token price has been in the green zone despite the industry falling apart.
- 200-day MA and 50-day MA are positioned parallel, YFI could move sideways.
Yearn. finance (YFI) is up 3.49% in the last 24 hours, and at press time YFI is trading at $6,478.10, according to CoinMarketCap. Notably, when all the cryptos have gone through a gloomy phase, YFI has been trading in the green zone as shown in the chart below.
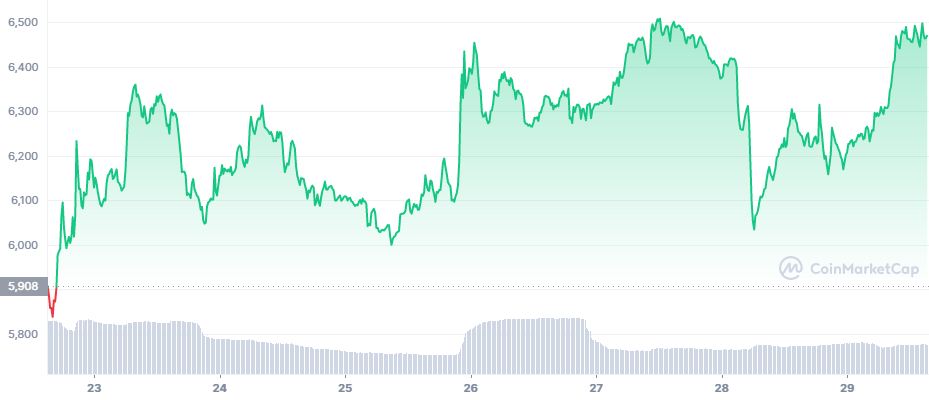
YFI reached its lowest of $5,837 last Tuesday. However, the bulls drove the price of YFI up, and subsequently, YFI reached its highest of $6,503 on Sunday. Although, within 24 hours the price of YFI tanked to $6,028.
Meanwhile, the price of YFI is fluctuating in a bullish pennant pattern as shown in the chart below. The price has been moving sideways while fluctuating up and down within a given range.
YFI tried to test Resistance 1 on previous occasions, however, it didn’t have the momentum to break through. Lately, during the last 10 days of November, YFI has been bouncing off Support 1. Right now it is looking very bullish and could test Resistance 1.
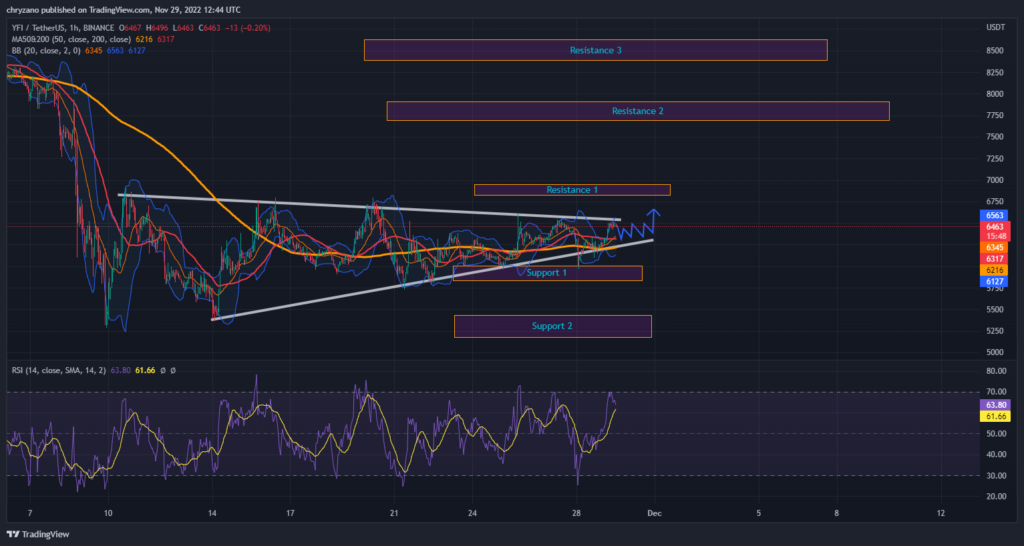
The Bollinger bands have expanded depicting that there could be higher oncoming volatility. Interestingly, YFI has touched the upper Bollinger band, as such, the market could correct the price. However, the Relative Strength Index is at 66.67 which means YFI is still not in the overbought region. Hence, YFI could continue the current trend.
There lies a possibility of YFI rebounding off its immediate resistance, the 50-day MA (Red line). Additionally, the 50-day MA and 200-day MA are positioned parallel which indicates that the price could move sideways.
If YFI gets enough momentum from the bulls then it would target to hit Resistance 1, which is positioned between $6,800 – $7,000. With excessive force from the bulls, YFI may target Resistance 2 based between $7,750 and $8,000. Furthermore, if the market is dominated by bulls for an even longer period of time then YFI may hit Resistance 3 based between $8,250 and $8,750.
Contrastingly, if the bears dominate the market, then YFI may look at landing on Support 1 which is based between $5,800 – $6,100. With further bear dominance, the price of YFI could tank to Support 2 which is based between $5,200-$5,400.
Disclaimer: The views and opinions, as well as all the information shared in this price analysis, are published in good faith. Readers must do their own research and due diligence. Any action taken by the reader is strictly at their own risk, Coin Edition and its affiliates will not be held liable for any direct or indirect damage or loss.
Disclaimer: The information presented in this article is for informational and educational purposes only. The article does not constitute financial advice or advice of any kind. Coin Edition is not responsible for any losses incurred as a result of the utilization of content, products, or services mentioned. Readers are advised to exercise caution before taking any action related to the company.

 Price Prediction 2026, 2027, 2028, 2029, 2030-2050")


