
Market research platform Layergg posted on X that the AI narrative was one to watch. The platform rode on the post made by Ethereum (ETH) co-founder Vitalik Buterin.
Earlier, Coin Edition reported that Buterin had explained how the combination of AI and Crypto could play out. In this article, we consider 10 AI tokens that traders might want to keep on their radar.
Internet Computer (ICP)
Internet Computer is powered by cryptography and employs it in cloud computing which has some AI backing. Concerning its token price, it has increased by 102% in the last 365 days.
However, ICP has had a torrid start to 2024. At press time, the value has lost 15.85% in the last 30 days. But from the technical perspective, ICP could offer a buying opportunity.
Based on the 4-hour chart, ICP’s price was $11.39. However, the 0.786 Fibonacci retracement showed that it could drop to $10.92. If ICP decreases, buying the token at this level could be a good entry before it recovers.
Indications from the MACD also showed that a downward momentum was imminent since the reading was negative.
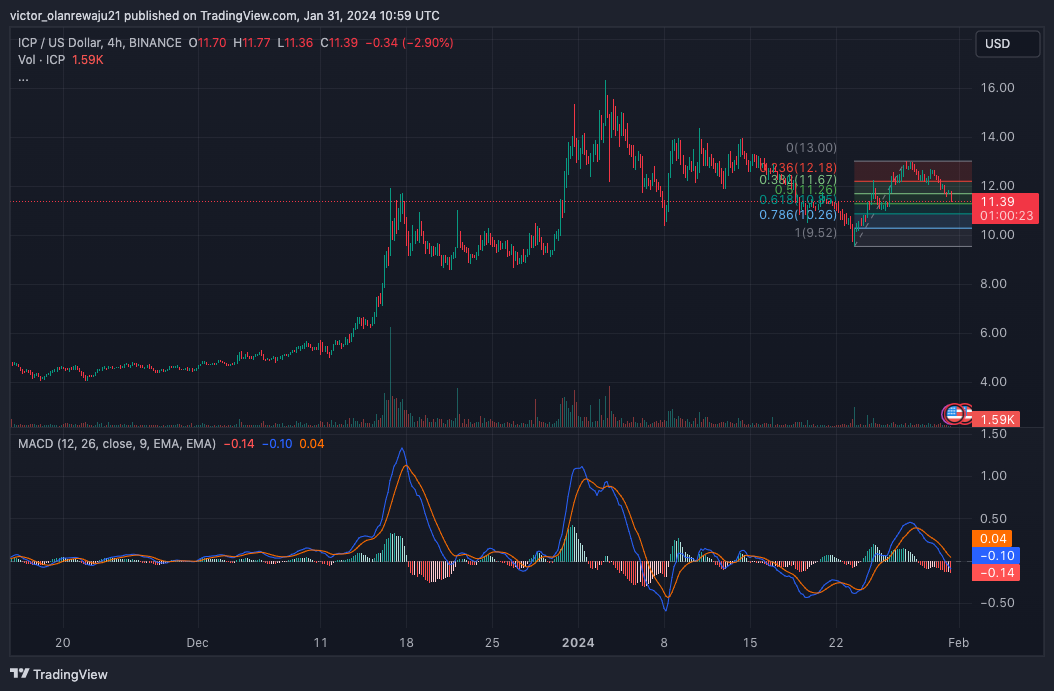
ICP/USD 4-Hour Chart (Source: TradingView)
In the short term, ICP might not rally. But the long-term outlook based on its fundamentals looked promising.
Worldcoin (WLD)
The fact that OpenAI CEO Sam Altman co-founded Worldcoin(WLD) makes it a project to watch. Although the project faced controversy since its launch, it remains one with a possible long-term potential.
In the last 30 days, WLD’s price has decreased by 34.03%. In the short term, the cryptocurrency might find it hard to reach $3. This was because of the resistance at $2.45. The RSI also showed that the bullish momentum has reversed.
But its double-digit correction might mean that traders could buy at a discount. In a highly bullish case, WLD might rally to $3.95. However, the price could still drop below $2.20.
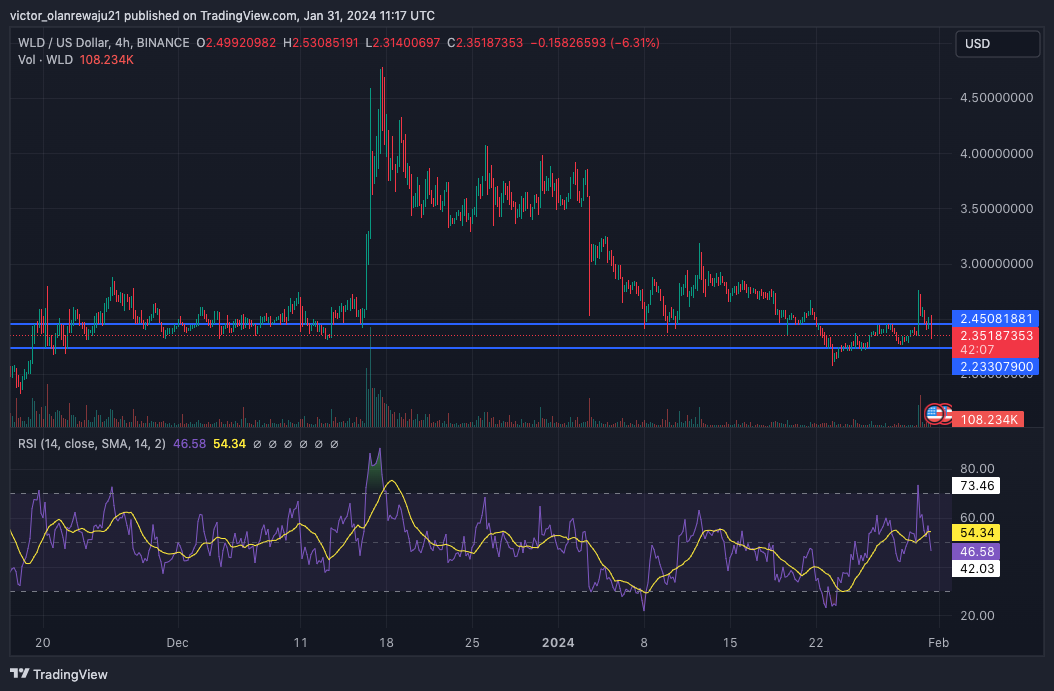
WLD/USD 4-Hour Chart (Source: TradingView)
Injective (INJ)
Despite rising as high as $45 a few weeks ago, INJ dropped and was trading at $34.60. The Bollinger Bands (BB) showed that volatility was no longer high. So, INJ might continue trading in a tight range.
However, this lack of volatility could be an opportunity for participants to buy. If the bands expand, INJ could break out, and a move toward $50 could be possible.
Furthermore, the RSI showed that INJ was not overbought or oversold. So, there is still a chance for bulls to come in and push the price higher.
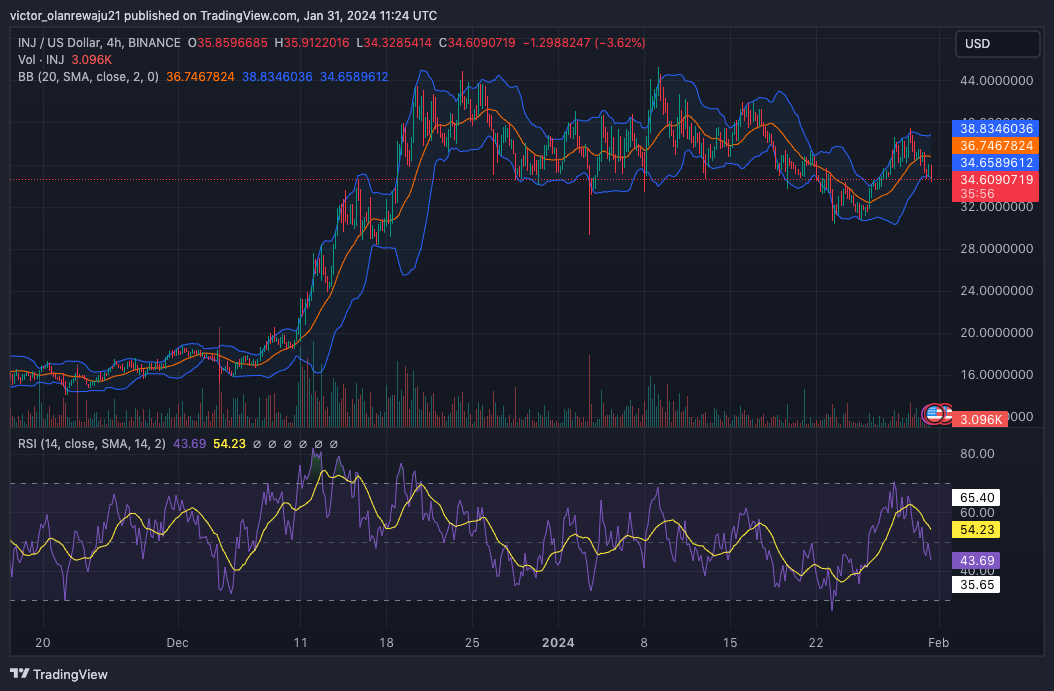
INJ/USD 4-Hour Chart (Source: TradingView)
Render (RNDR)
On the 4-hour timeframe, RNDR’s structure was bullish. Within a couple of days, the price went from $3.97 to $4.57. However, as the RSI showed that the token was initially overbought when it hit $4.77, RNDR retraced
However, with a support at $41.3,[1] RNDR might retest the $4.77 resistance. If it flips it, then the price could rise as high as $5.50. But if does not move below, $4.20 could be next.
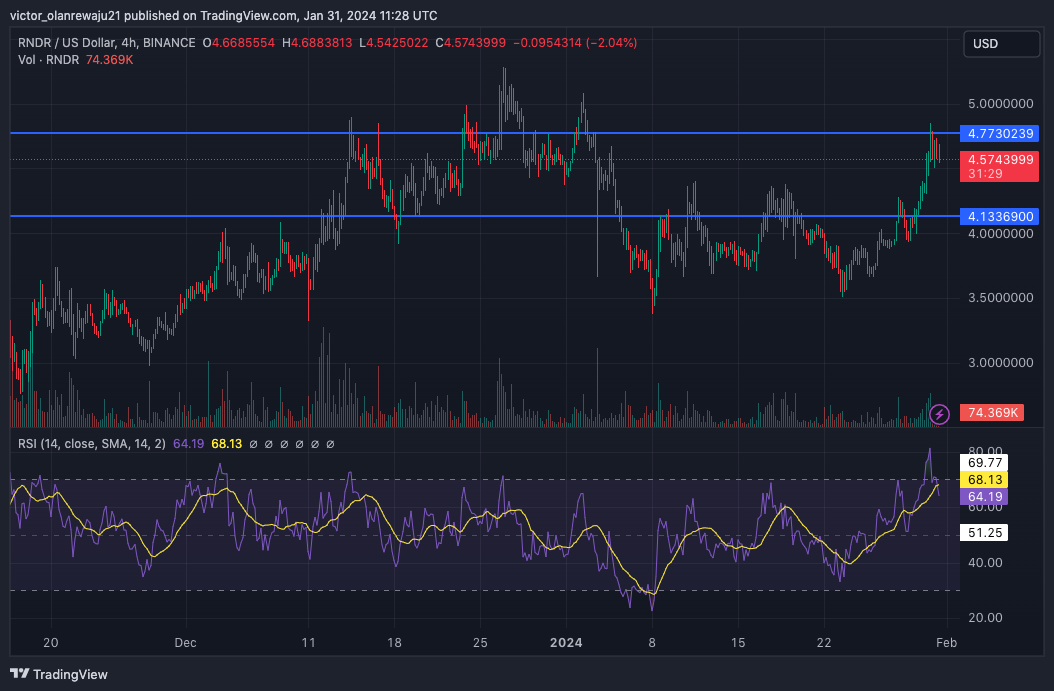
RNDR/USD 4-Hour Chart (Source: TradingView)
Akash Network (AKT)
Over the last year, AKT increased by 756%. This year, it has been performing well too, increasing by 17.52% on a Year-To-Date (YTD) basis.
At press time, AKT changed hands at $2.08. However, it seemed market players were taking profit off the token. At press time, the Awesome Oscillator (AO) had turned negative. This suggests that sellers were more dominant.
The Chaikin Money Flow (CMF) also showed that liquidity was exiting the Akash ecosystem. If this continues, the price of AKT might drop to $2.50. However, the token still has the potential to repeat the performance it had in the last year.
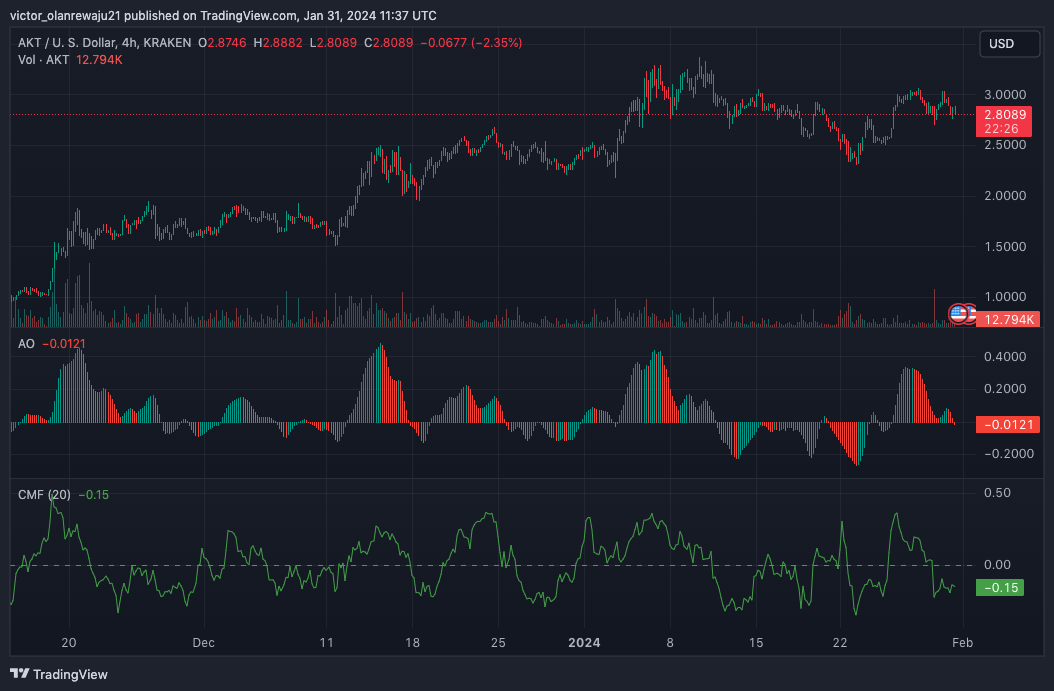
AKT/USD 4-Hour Chart (Source: TradingView)
The Graph (GRT)
GRT seemed to have a similar structure to AKT. But the difference was the fact that GRT’s performance since the new year began has been unimpressive.
In the short term, GRT’s price could fall below $0.15. This was due to the signals shown by the EMA. As of this writing, the 9 EMA (blue) intersected with the 20 EMA (yellow), indicating a possible sideways movement. But if GRT drops below $0.12, it could be a good entry for the long term.
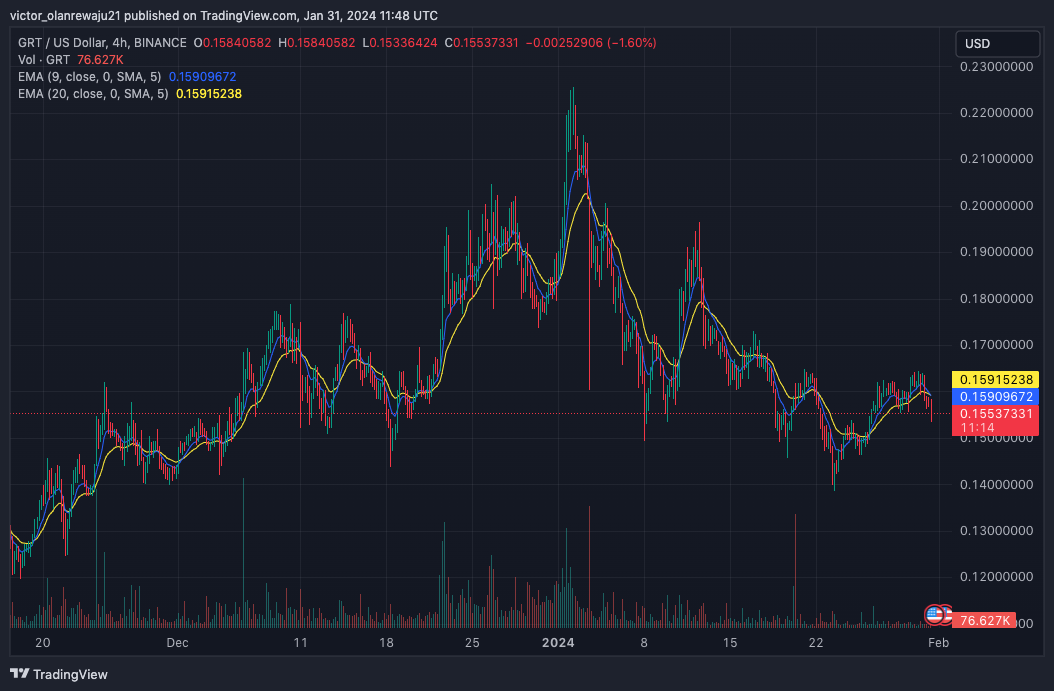
GRT/USD 4-Hour Chart (Source: TradingView)
Oasis Network (ROSE)
ROSE’s price at press time was $0.10. But unlike GRT, the short-term trend looked bullish. This was due to the upward crossover of the 9 EMA (blue) over the 20 EMA (yellow). However, the price of the token has dropped below the EMA suggesting that sellers were present.
Should the crossover stay the same and buyers come in, ROSE might run to $0.12.In the long term, the budding AI narrative could drive the price much higher.
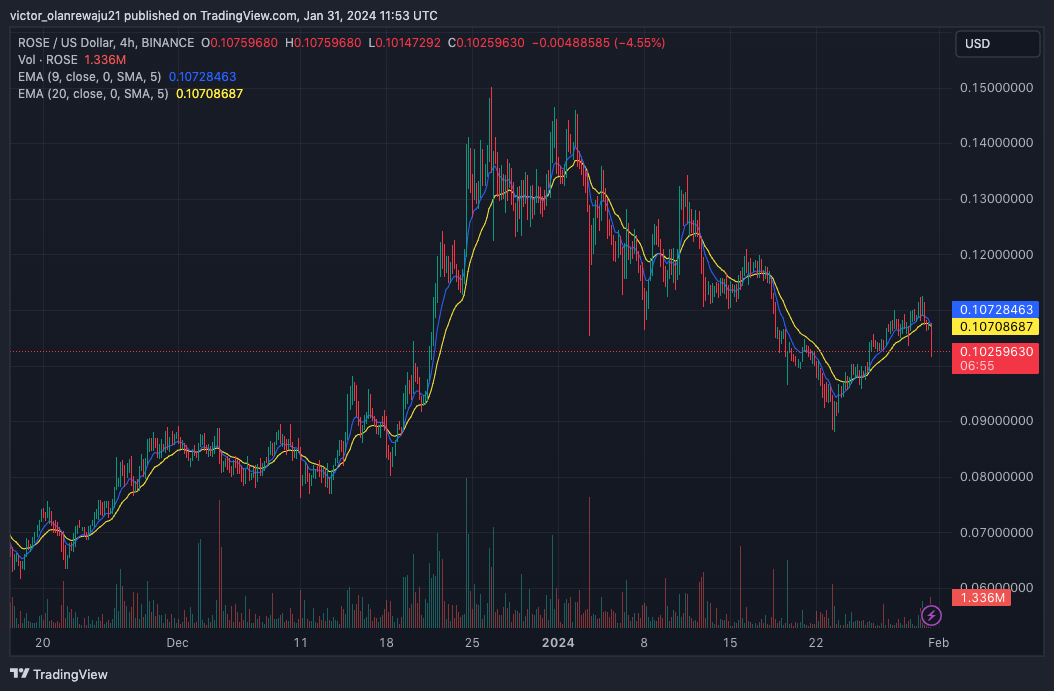
ROSE/USD 4-Hour Chart (Source: TradingView)
Fetch.ai (FET)
FET’s price this year has fallen by 20.94%. But the decline seemed like a necessary correction considering how impressive it had performed in the last 90 days.
At press time, selling pressure has pushed down the support to $0.59. Although FET was trading at $0.57, the price could drop to $0.55 which was the next support zone.
If bulls do not defend this support, then FET could hit $0.49. If this happens, a bullish reversal might occur and send the price higher.
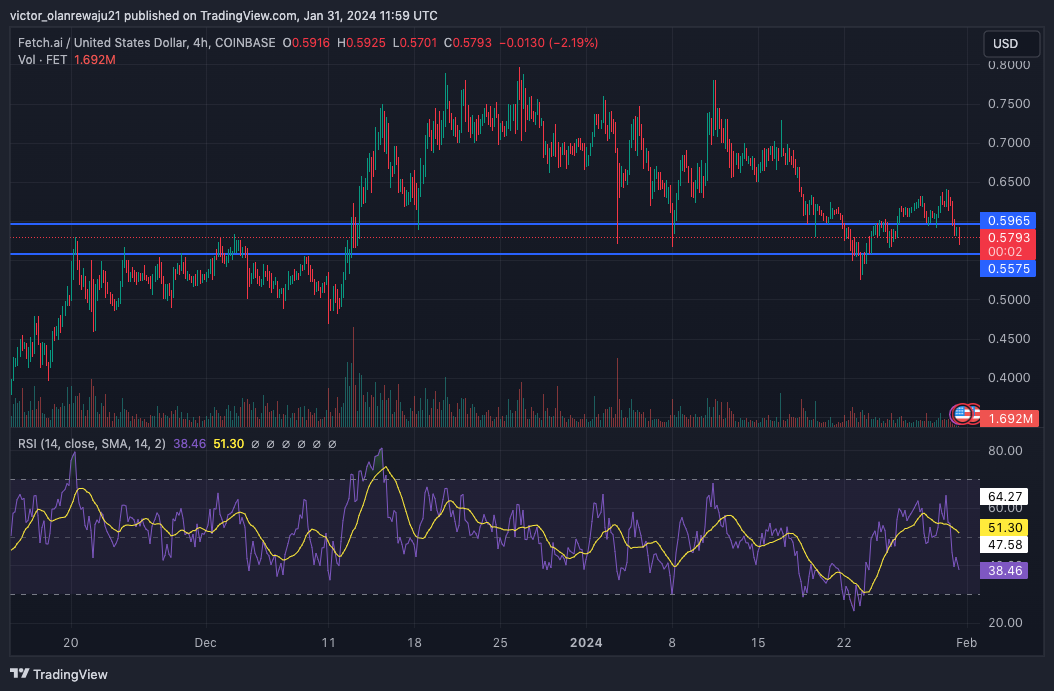
FET/USD 4-Hour Chart (Source: TradingView)
At press time, the RSI was down to 38.46. Should selling intensify, the reading might reach 30.00. If this happens, traders should look for entries as FET might trade much higher than it currently is.
SingulartyNET (AGIX)
The On Balance Volume (OBV) on the 4-hour AGIX/USD chart showed that buying has been flat for a while. That is one of the reasons the token has been confined between $0.25 and $0.28.
Signals from the RSI, however, showed that sellers were more dominant. Therefore, there is a chance that AGIX’s price might decrease.
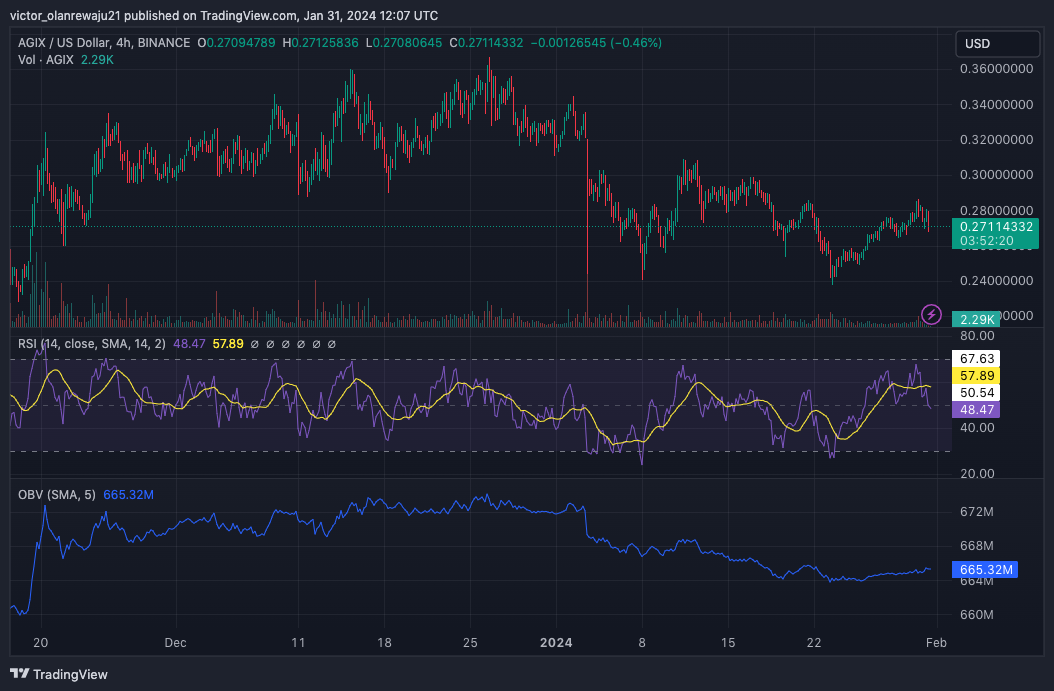
AGIX/USD 4-Hour Chart (Source: TradingView)
From a bearish point of view, the price could fall to $0.24. However, a surge in buying pressure might send AGIX well above $0.35.
Bittensor (TAO)
Volatility around TAO has been wild lately, the Bollinger Bands (BB) showed. At press time, the price was $449.92, reflecting how bulls have been in control of the direction.
Also, the Chaikin Money Flow (CMF) reading was $0.10. This reading suggests that buying pressure was intense. Should the pressure continue to pump the CMF in the positive region, then TAO might tap $460.
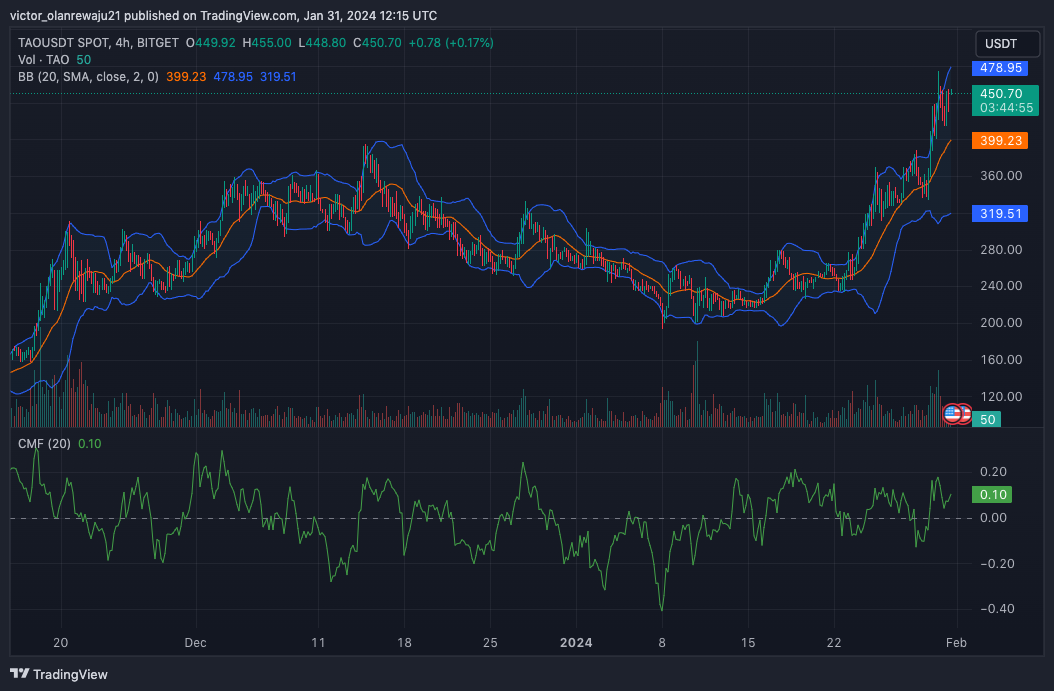
TAO/USDT 4-Hour Chart (Source: TradingView)
Also, the expanding bands of the BB implied that price fluctuations could be maximal., TAO’s price reaching $500 remains an option.
Disclaimer: The information presented in this article is for informational and educational purposes only. The article does not constitute financial advice or advice of any kind. Coin Edition is not responsible for any losses incurred as a result of the utilization of content, products, or services mentioned. Readers are advised to exercise caution before taking any action related to the company.


