


 Final Unlock Is Something to Keep an Eye On")
- The last set of the locked INJ tokens would hit the market by January 21.
- An analyst noted that INJ had formed a bullish flag and might surpass $60.
- INJ needs to breach the $40.28 resistance to confirm the breakout.
Layer-one blockchain Injective (INJ) is gearing up for the final phase of its token unlock, the Token Unlocks handle on X disclosed. According to the post, INJ would be fully unlocked on January 21.
With 3.66 million tokens set to be released, the unlock would mean that 100% of the total INJ supply would be in circulation.
INJ Prepared to Rally, Analyst Says
At press time, about 83.75 million INJ tokens were in circulation. So, if the 4.35% enters the market, the entire circulating supply would be 100 million.
Furthermore, the token unlock would give market participants who have missed INJ’s impressive run to have a share of the cryptocurrency. At press time, INJ’s price was $37.70.
But it is noteworthy that the cryptocurrency’s All-Time High (ATH) was $44.61 on December 26, 2023. According to CoinMarketCap, INJ’s All-Time Low (ATL) was $0.65, indicating that the price has increased by 3,515% since its launch in 2020.
As a result of the forthcoming event, some market participants believe that the cryptocurrency could be ready for another rally. One example of the predictions was from analyst Captain Faibik.
According to Faibik, INJ had formed a bullish flag and could be on the cusp of a rise above $60. From the chart shared by the analyst, the token had formed two rallies joined by a brief consolidation period.
So, the price action might go on a continuous uptrend. In the process, INJ could form more higher highs and higher lows. Despite its 100% 30-day increase, INJ was affected by the market crash of January 3.
Selling Pressure Poses a Threat
This collapse was what initially led the price to $33.55. An evaluation of the 4-hour INJ/USD chart showed that volatility had begun to increase.
Indications from the Bollinger Bands (BB) also revealed that INJ’s previous rise to $40.28 made it overbought. At that price, the upper band of the BB hit INJ. However, that does not mean that the price fluctuations would not be significant.
But the same $40.28 has become a major resistance level. To flip the level, a wave of buying pressure has to overcome the cluster of sell orders there.
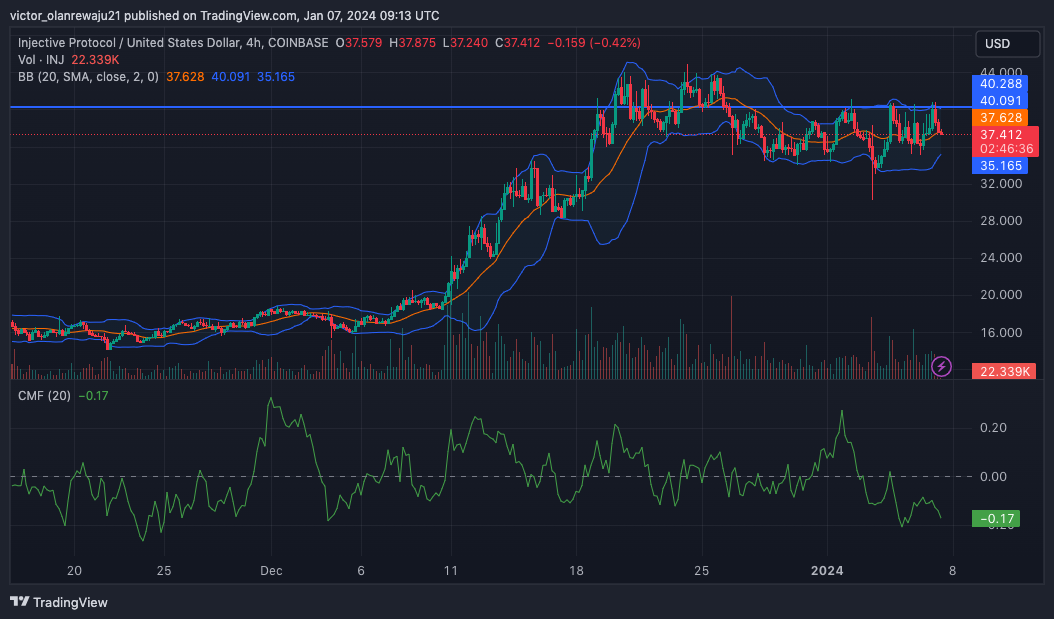
However, the Chaikin Money Flow (CMF) showed that the possibility of a quick bullish turnaround was low. This was because the CMF was -0.17, indicating an increase in selling pressure.
Regardless of the current state, INJ remains a candidate to fly. As long as the price action holds above $35, a move in the $60 direction as predicted by the analyst might be possible.
Disclaimer: The information presented in this article is for informational and educational purposes only. The article does not constitute financial advice or advice of any kind. Coin Edition is not responsible for any losses incurred as a result of the utilization of content, products, or services mentioned. Readers are advised to exercise caution before taking any action related to the company.


