


- Technical indicators for AVAX, ADA, ZIL, XRP, and LINK suggest that these alts may skyrocket in the short term.
- A medium-term technical flag was on the cusp of being triggered on LINK’s daily chart.
- ZIL could reach $0.02771 before the end of this month if it is able to overcome the 20-day and 50-day EMA lines.
The cryptocurrency market has been experiencing some notable price fluctuations, with several cryptocurrencies poised for potential bullish rallies. Among the top contenders are ADA, AVAX, ZIL, XRP, and LINK, which have been showing promising signs of entering into significant upward trends.
Avalanche (AVAX)
Most of the top 50 cryptocurrencies saw their prices drop over the past 24 hours of trading, and Avalanche (AVAX) was no exception according to CoinMarketCap. At press time, AVAX was trading at $13.06, reflecting a 1.29% decline over the past 24 hours.
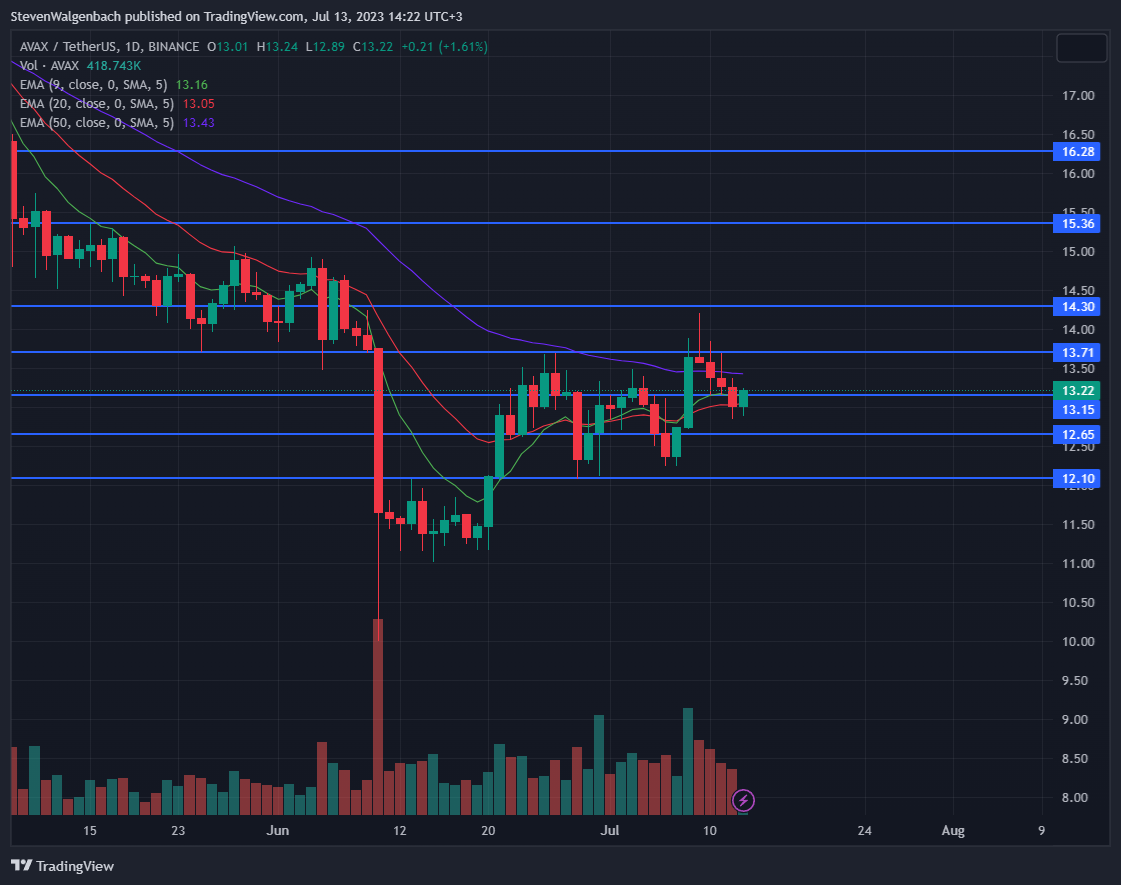
AVAX’s price was looking to challenge the major resistance level at $13.15 at press time. Should the altcoin succeed in breaking above this price point, it may attempt to do the same with the 50-day EMA line in the following few days. Rising above this technical indicator will be a noteworthy achievement for AVAX, and may be an early indication of a potential rally.
Should this bullish thesis play out, AVAX will most likely flip the resistance levels at $13.71 and $14.30 into support. Thereafter, the crypto will just need to overcome $15.36 before a path will clear for it to rise to $16.28.
On the other hand, if AVAX is rejected by the aforementioned $13.15 resistance level today, then it may be at risk of falling to the minor support at $12.65 in the next 48 hours. Continued sell pressure may drag AVAX to the crucial support level at $12.10 in the coming week.
Traders and investors may want to keep an eye on the 9-day and 20-day EMA lines for the next few days. At press time, the 9-day EMA line was attempting to cross below the longer technical indicator. Should this cross happen, it will invalidate the bullish thesis and will also signal that AVAX has entered into a short-term bearish trend. This may result in AVAX dropping to $12.10.
Chainlink (LINK)
Chainlink (LINK) experienced a modest increase of 0.72% in the last day of trading. As a result, the altcoin was valued at $6.13 at press time. Nevertheless, its weekly performance remained down by 0.99%.
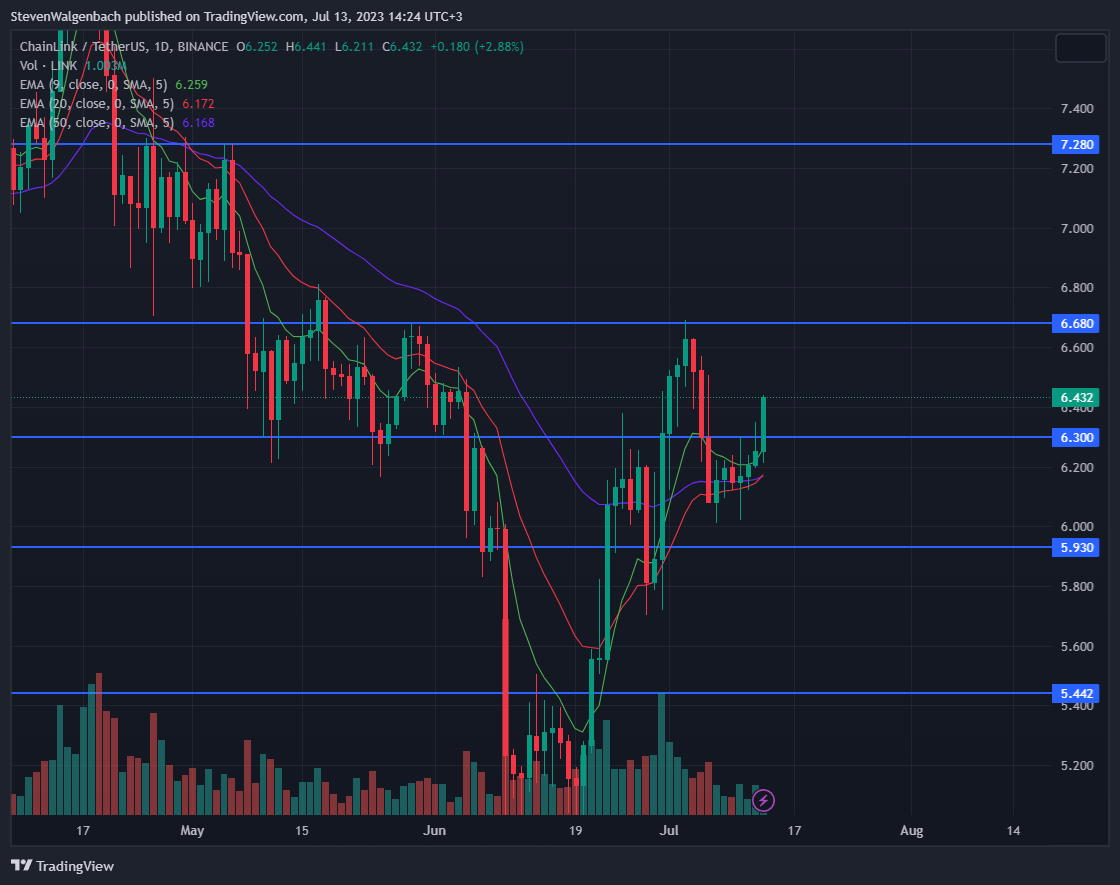
LINK was attempting to flip the strong resistance level at $6.30 at press time. It had broken above this level in the past 24 hours and continued to trade above the key price point at press time. If the altcoin is able to close today’s daily candle above this resistance level, then it may continue to climb to $6.680 in the following week.
Continued buy pressure may even push LINK’s price above $6.680, which will give the crypto an opportunity to rise to $7.280 as well. However, if LINK is unable to close today’s daily candle above the $6.30 resistance, then its price may fall to $5.930 in the next 24-48 hours. Continued sell pressure could result in LINK’s price falling to as low as $5.442 in the following week.
Technicals on LINK’s daily chart suggested that its price may rise in the short-term. Furthermore, a medium-term bullish technical flag was also on the verge of being triggered. The 9-day EMA line was positioned above the 20-day and 50-day EMA lines after crossing above the longer technical indicators throughout the past few weeks.
This signaled that LINK was in a short-term bullish cycle and its price may rise in the next few days. Meanwhile, the 20-day EMA line was attempting to cross above the 50-day EMA line. Should this cross happen, it could give LINK the momentum it needs to break above $6.68 and potentially $7.280 in the upcoming 2 weeks.
Cardano (ADA)
Cardano (ADA) witnessed a decline of over 2% within the past 24 hours, which brought its price down to $0.2866. This put ADA very close to its daily low of $0.2859. Furthermore, compared to its all-time high of $3.10 that was reached in September of 2021, ADA has suffered a decline of over 90%.

ADA printed higher lows and consistent highs over the past 2 weeks – resulting in the formation of a bullish pennant on its daily chart. If this chart pattern is validated, the altcoin’s price will most likely flip the resistance level at $0.3017 into support. Should this happen, ADA will also flip the 50-day EMA line into support.
This may give the crypto the bullish support needed to also break above $0.3232 and $0.3493 in the following week. On the other hand, if ADA’s price closes the next 48 hours under the 9-day and 20-day EMA lines at approximately $0.2893, then it may be at risk of falling to the key support at $0.2769 in the following 48 hours.
Investors and traders will want to keep an eye on the 9-day and 20-day EMA lines over the next few days, as the two technical indicators were almost overlapping at press time. The 9-day EMA crossing below the 20-day EMA may be a confirmation of the bearish thesis playing out.
On the other hand, the 9-day EMA line breaking away above the longer EMA will invalidate the bearish thesis. Should this happen, ADA’s price may flip the aforementioned $0.3232 resistance into support in the following 48 hours.
Ripple (XRP)
Ripple (XRP) also experienced a drop in price throughout the past day of trading, as it printed a 24-hour loss of 0.62%, which also pushed its weekly performance further into the negative territory by -1.23%. As a result, it was trading at $0.4722 at press time.
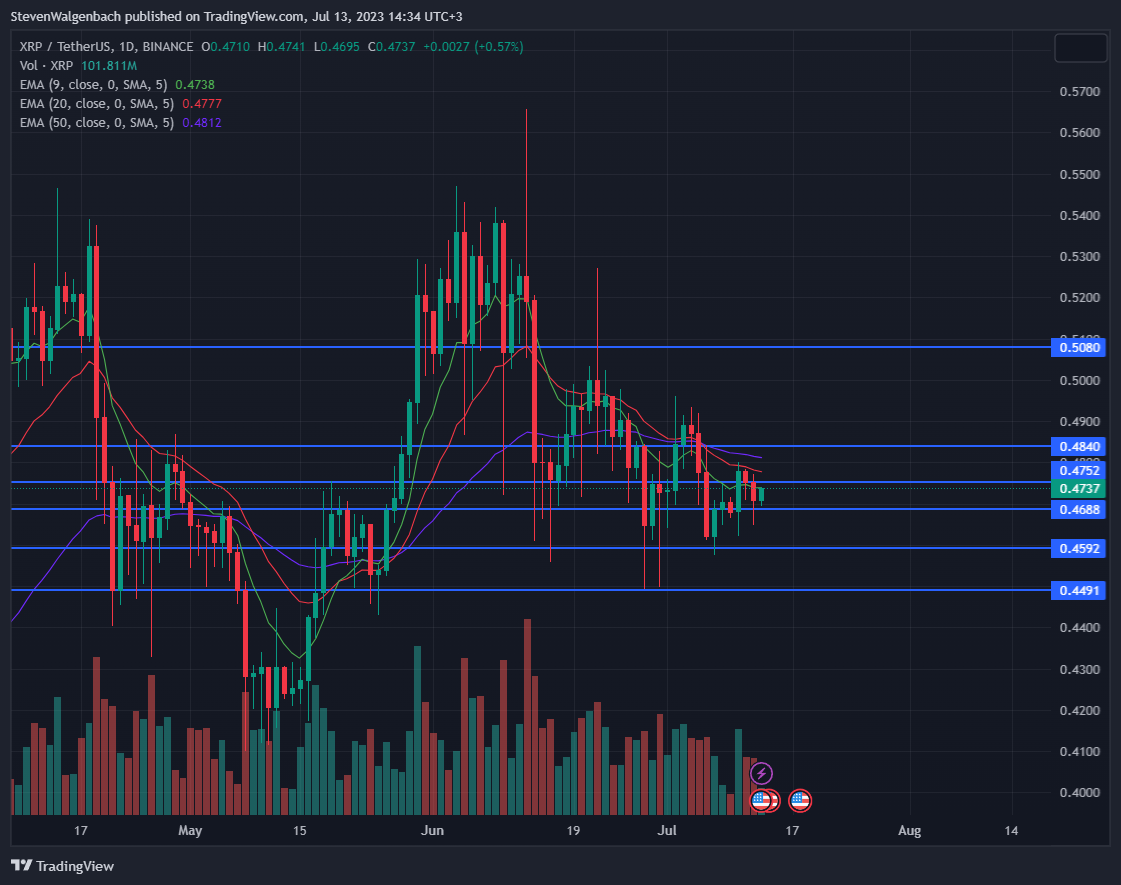
The 9-day EMA line was acting as resistance for XRP’s price at press time. Nevertheless, the remittance token’s price was still trading above the support level at $0.4688 after it had dropped below the significant price point during yesterday’s trading session.
If XRP can overcome the 9-day EMA in the next 48 hours then it may also flip the resistance at $0.4752 into support in the same move. Thereafter, the crypto will have to attempt to break above the 20-day and 50-day EMA lines before it can test the next major resistance at $0.484.
If XRP succeeds in breaking above the 20-day and 50-day EMA lines, it will have very little resistance standing in its way – opening a path for the altcoin’s price to potentially rise to $0.5080 in the following week. However, the aforementioned bullish thesis will be invalidated if XRP breaks below the minor support at $0.4688 in the next 48 hours.
Should this happen, the crypto’s price may drop to $0.4592 in the following few days. Continued sell pressure may even push XRP down to $0.4491 in the coming week.
Zilliqa (ZIL)
Zilliqa (ZIL) saw a 1.52% price drop over the past 24 hours, bringing its value down to $0.0207 at press time. As a result, ZIL was trading closer to its daily low of $0.0206, rather than its 24-hour high of $0.02109.
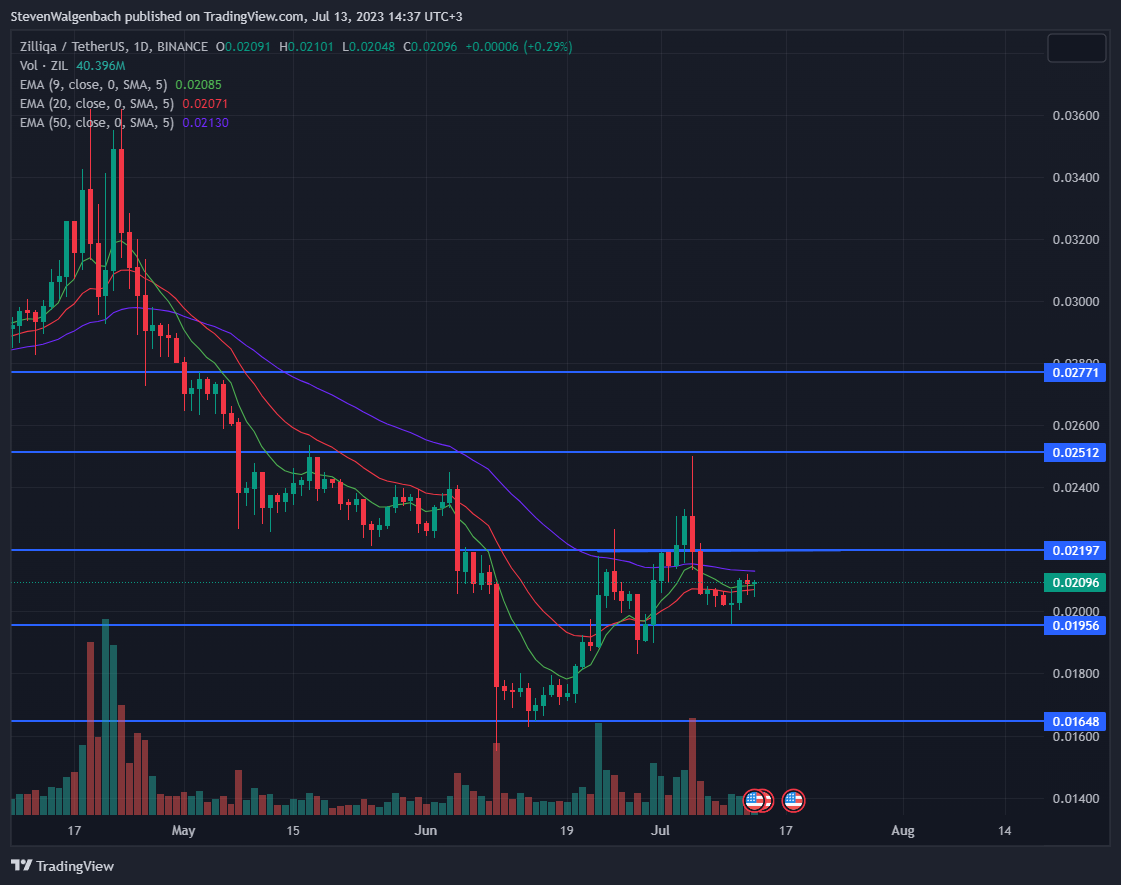
Bulls were attempting to elevate ZIL’s price to above the 50-day EMA line, which was evident by the wick that was present underneath today’s daily candle. This may lead to the formation of a bullish hammer candlestick, which may indicate that ZIL has reached a bottom and is poised for a strong move up in the following couple of days.
If bulls succeed in pushing the altcoin’s price above the 50-day EMA line, then the positive momentum may be enough to also flip the strong resistance level at $0.02197 into support within the following 24-48 hours.The next target for ZIL’s price will then be $0.02512.
From a technical perspective, there will be very little in the way that could prevent the altcoin from rising to this next major resistance level over the coming 2 weeks. Continued bullish momentum may even result in ZIL reaching $0.02771 before the end of this month.
This bullish thesis will be invalidated, however, if ZIL is unable to close a daily candle above the previously-mentioned 50-day EMA line over the course of the next 2 days. In this scenario, the altcoin could drop down to $0.01956 in the short term, and potentially fall to $0.01648 in the medium-term.
Disclaimer: The views and opinions, as well as all the information shared in this price analysis, are published in good faith. Readers must do their own research and due diligence. Any action taken by the reader is strictly at their own risk. Coin Edition and its affiliates will not be held liable for any direct or indirect damage or loss.
Disclaimer: The information presented in this article is for informational and educational purposes only. The article does not constitute financial advice or advice of any kind. Coin Edition is not responsible for any losses incurred as a result of the utilization of content, products, or services mentioned. Readers are advised to exercise caution before taking any action related to the company.


