


- The prices of XEC, BTT, and XLM might extend toward new highs as bulls dominate the charts.
- SUI presented a buy signal at $1.46, ALGO sellers became weak while LTC might pull back.
- RB flashed a sell signal, FIL’s price might decrease while INJ displayed high volatility.
After a widespread hike a few weeks ago, the prices of many cryptocurrencies have decreased. While some have made attempts at hitting previous peaks, most have been unsuccessful. However, there have been a select few that have defied the odds. Here is a thorough assessment of nine cryptocurrencies in the market. Read on.
eCash (XEC)
XEC was one of the tokens which outperformed the majority of the cryptocurrencies in the market. At press time, XEC changed hands at $0.000063. This was a 22.75% increase in the last 24 hours.
CoinMarketCap also showed that eCash’s volume jumped by 1,948% within the same period. The rise in volume meant that demand for the token was not artificial. If the volume continues to rise alongside the price, XEC might rise higher.
From a technical perspective, the Bollinger Bands (BB) indicated that volatility had increased around the token, suggesting massive price fluctuations. However, the upper band of the BB also touched XEC at $0.000065, indicating that it was overbought.
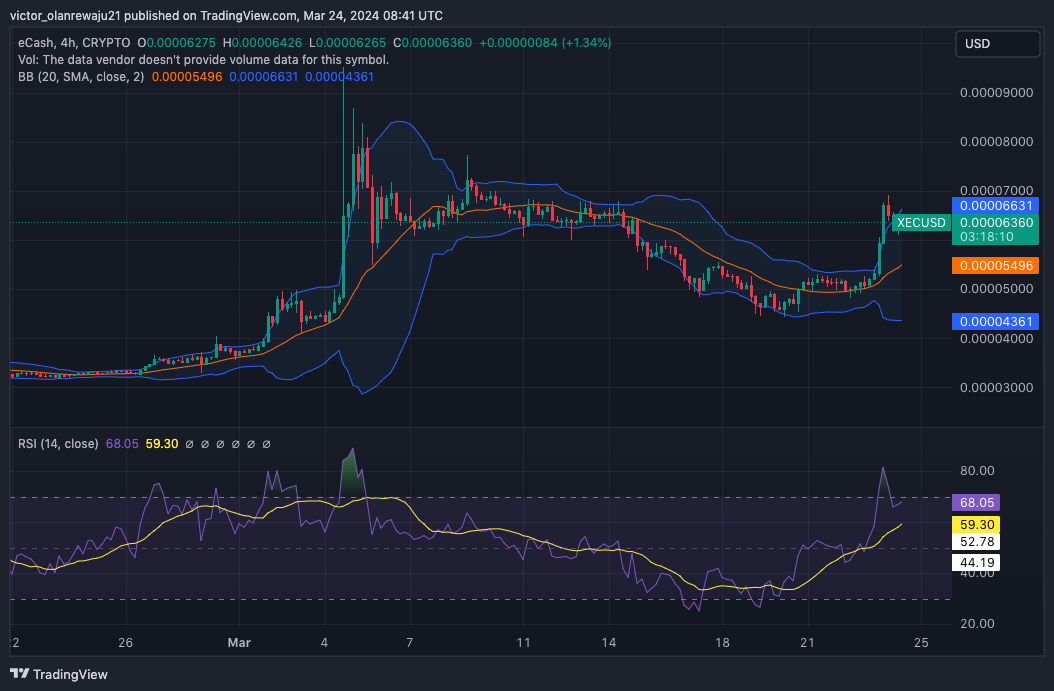
The Relative Strength Index (RSI) also hit 80.03 before its recent decrease, confirming the BB indications. However, the RSI reading had begun to increase, suggesting that XEC’s retracement was only for a short period.
Should bullish momentum dominate the charts, XEC’s price might rise toward $0.000070. On the other hand, the value of the token might decrease if bulls stall their influence.
Bittorent (BTT)
BTT was another token that displayed an uptrend on the 4-hour chart on March 23. Like XEC, the 24-hour volume also increased. But a bearish engulfing candlestick reversed the uptrend later on.
As a result, BTT’s price declined to $0.0000014. However, bulls were trying to push the price back up to $0.0000016 at press time. With the underlying support at $0.0000013, the attempt might be successful.
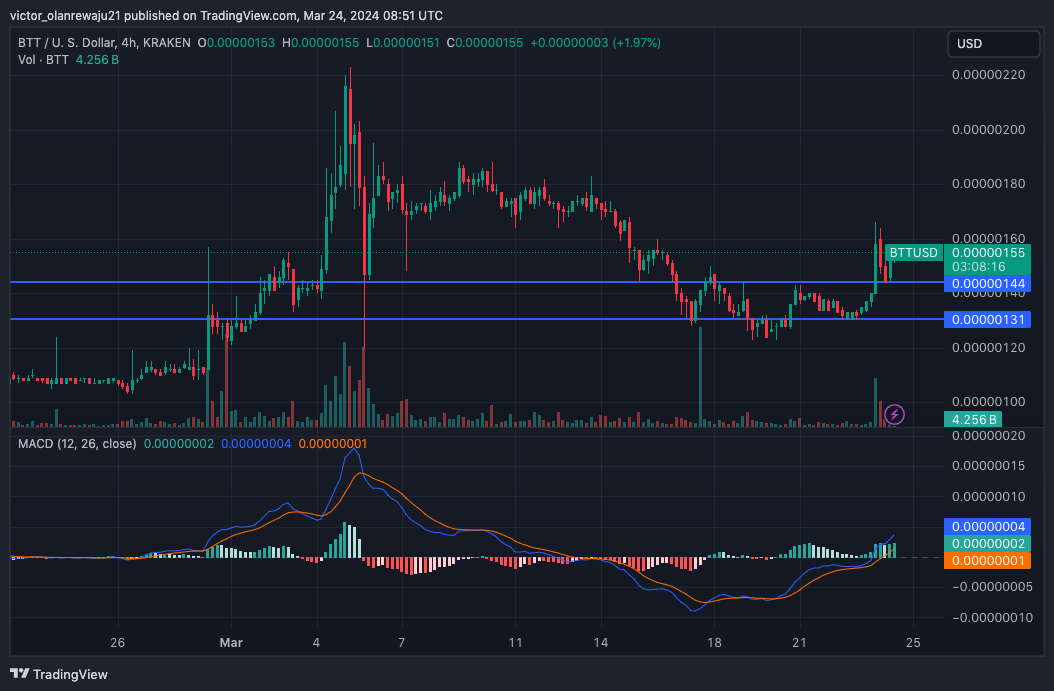
The Moving Average Convergence Divergence (MACD) also supported the bias as its reading flipped positive. As it stands, BTT’s price might extend as high as $0.0000018 in the short term.
Algorand (ALGO)
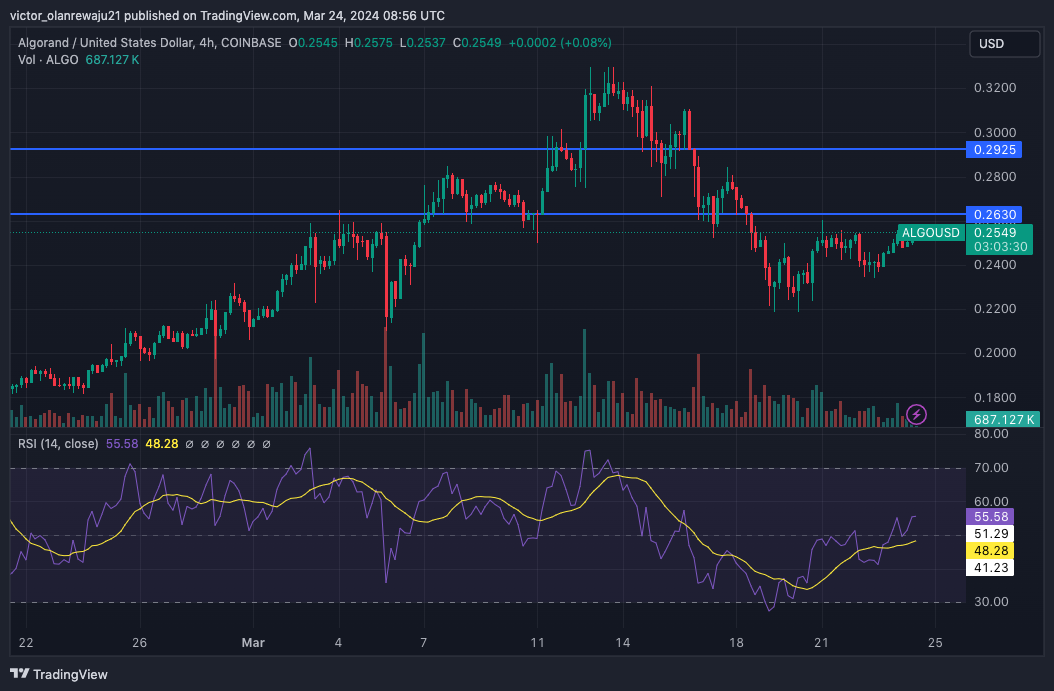
An analysis of the 4-hour ALGO/USD chart showed that the token was coming out of its depression phase. Previously, ALGO’s price had dropped from $0.32 to $0.22. But an upswing in the last 24 hours indicated that the correction might be over.
The Relative Strength Index (RSI) also backed up this forecast as the oscillator went northward. While ALGO attempts to climb, traders might need to watch out for resistance at $0.26, and another at $0.29.
If bulls can blast past the resistance, then ALGO might hit $0.30 in the short term. Conversely, bearish resistance might send the price back to $0.22.
Litecoin (LTC)
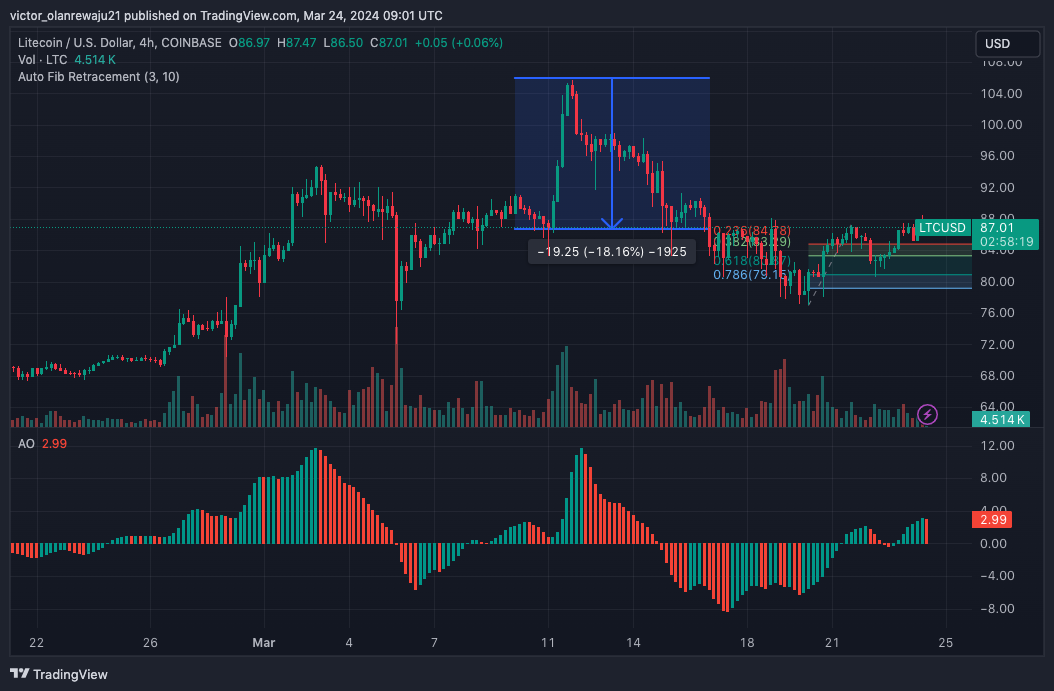
On the 4-hour timeframe, LTC mirrored a battle between bulls and bears. At press time, the coin was 17.98% down from the peak it reached on March 11. A look at the Fibonacci retracement showed that Litecoin’s price might pull back as low as $79.15.
This was where the 0.786 Fib level was positioned. Meanwhile, the Awesome Oscillator (AO) envisioned a bullish trajectory for LTC. But as of this writing, a red histogram bar had appeared on the AO, suggesting that the upward outlook could be invalidated.
SUI
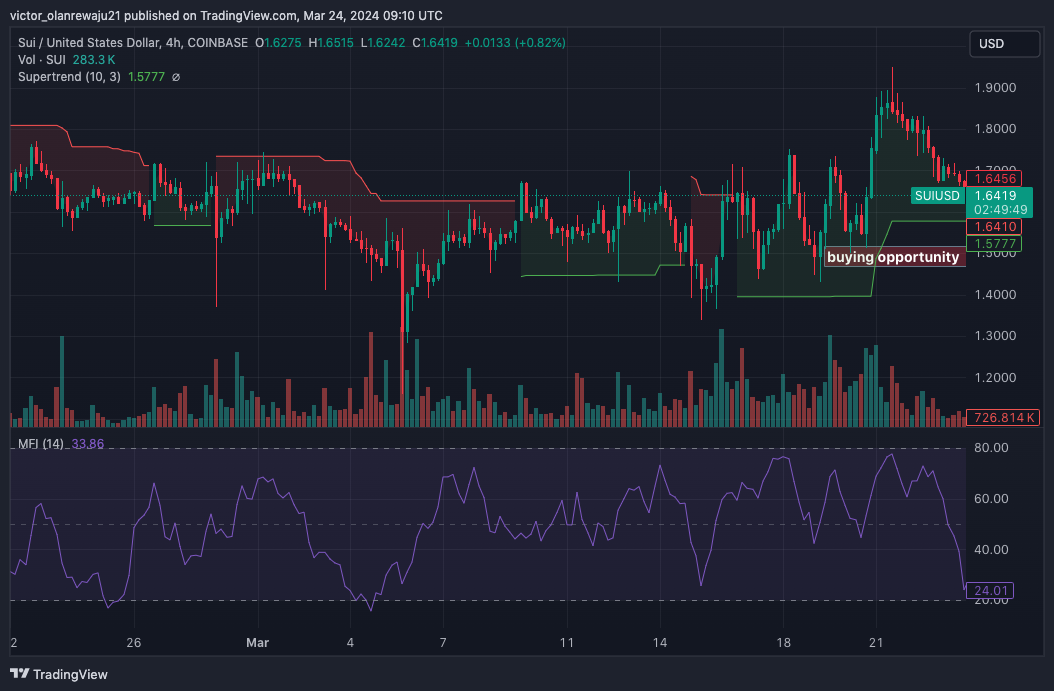
There was almost no bullish conviction on the SU/UD 4-hour structure. As of this writing, bears continued to dictate the direction of the price as it fell to $1.64. However, the massive decline meant that SUI sellers might soon be exhausted, and bulls might capitalize on that.
Signals from the Money Flow Index (MFI) agreed with this prediction as its reading reversed upwards. Interestingly, the Supertrend also aligned with the MFI, showing a possible buying opportunity at $1.64.
Filecoin (FIL)
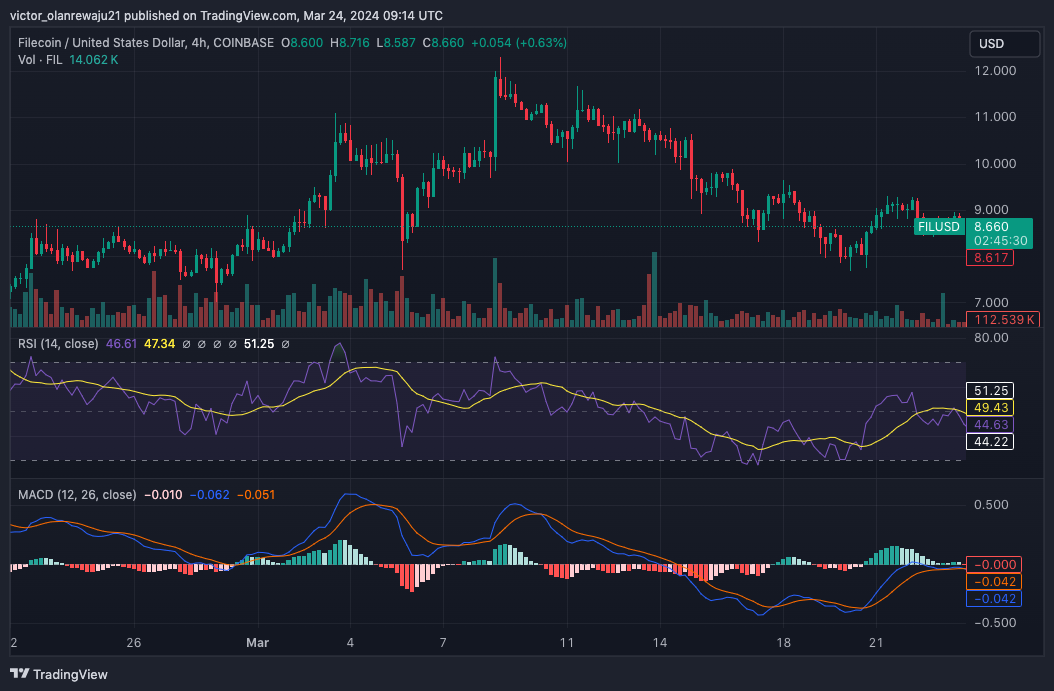
Filecoin almost hit $9.50 on March 22. But it encountered rejection at $9.17, leading the price to drop below the psychological $9 region.
From the analysis below, FIL’s price might continue to decline due to indications from the RSI. At press time, the RSI reading was 46.61, suggesting bearish momentum. However, the MACD was attempting to move into a positive territory.
If the MACD becomes positive, the signal from the RSI might take a backseat and FIL’s price might rise toward $10.65. But if the momentum stalls, the price of the token might decline to $8.02.
Arbitrum (ARB)
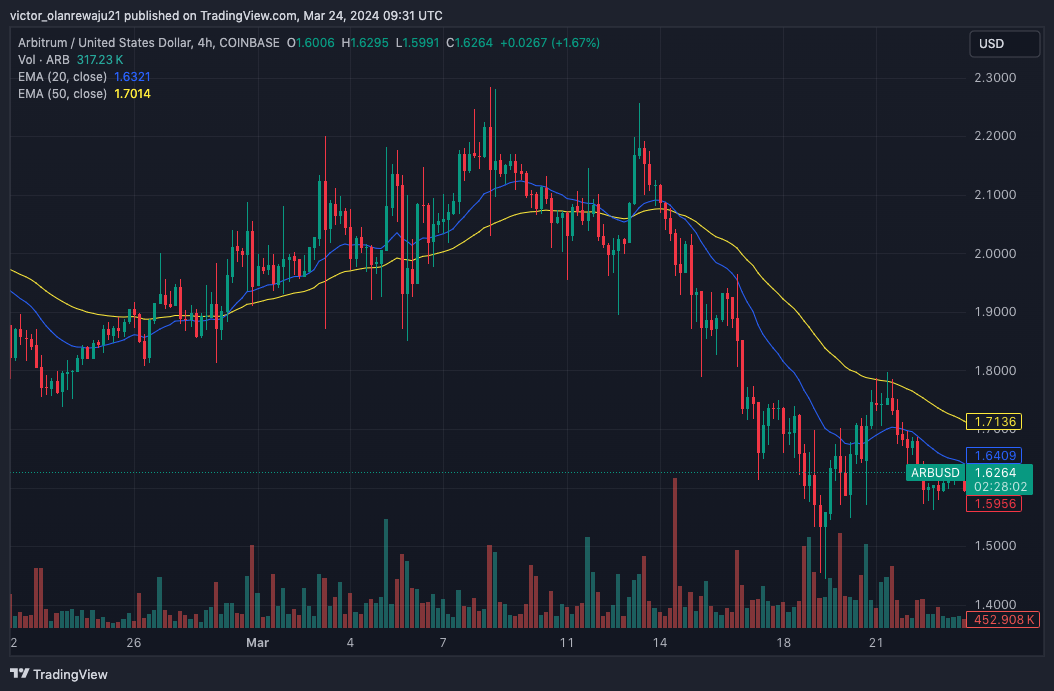
Despite the massive downturn ARB experienced, the Exponential Moving Average (EMA) flashed a sell signal. At press time, the 50 EMA (yellow) had crossed over the 20 EMA (blue), confirming the bearish bias.
Furthermore, ARB’s price was lower than both levels. With this trend, the value of the token might be set to hit $1.55 as there was little to no bullish appearance on the charts.
Stellar (XLM)
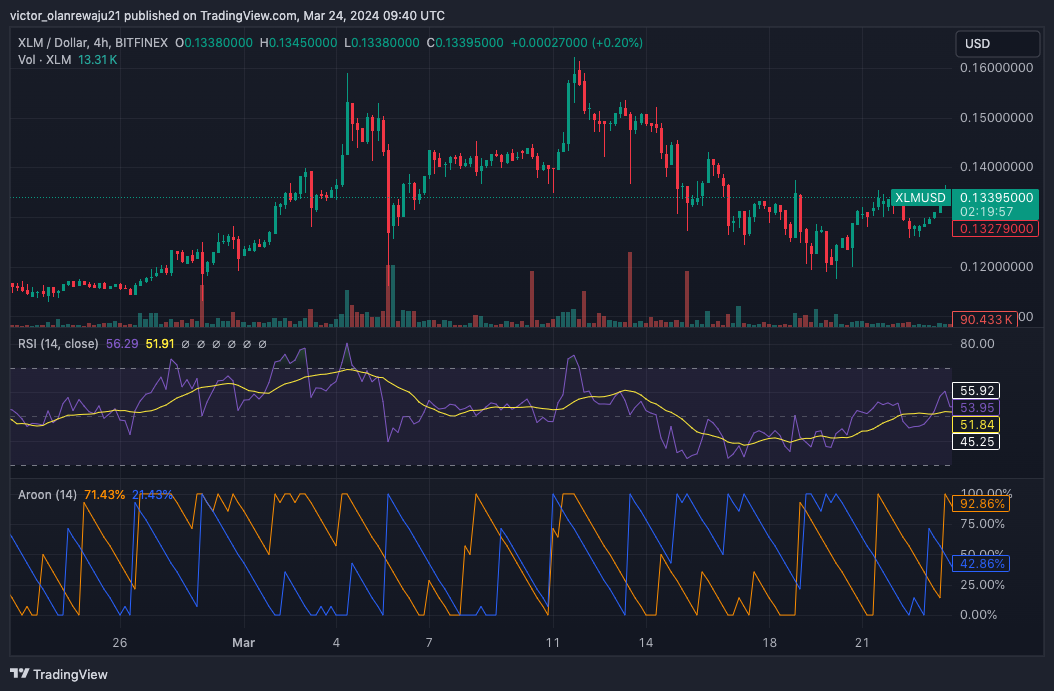
XLM’s trend of the 4-hour chart depicted a token set to leave the red candlesticks behind for a new high. As of this writing, XLM had gained 3.08% in the last 24 hours, and the Aroon indicator revealed that there could be more.
At the time of wrting the Aroon Up (orange) had a higher ratio than the Aroon Down (blue). Furthermore, the RSI reading displayed increased buying momentum which could help the token price increase.
Injective (INJ)
The INJ market structure was largely bearish at press time. However, the Bollinger Bands indicated that the token was oversold as the lower band hit the price at $34.75. This trend meant that INJ might have presented a buy signal considering the high volatility around the token.
In a highly bullish case, INJ’s price might extend to $39.39. For the bearish phase, the 4-hour analysis showed that the cryptocurrency might not slide below $34.80.
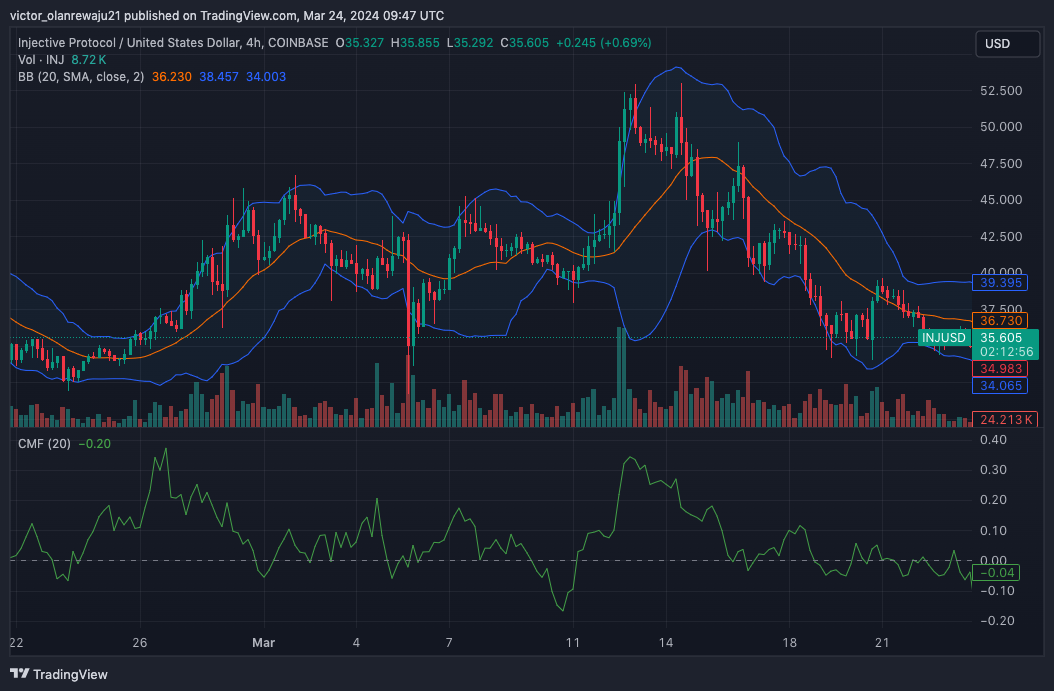
Another indicator we looked at was the Chaikin Money Flow (CMF) whose reading was negative. To validate INJ’s bullish outlook, more capital has to flow into the cryptocurrency. If not, the value might decrease much more than the prediction mentioned above.
Disclaimer: The information presented in this article is for informational and educational purposes only. The article does not constitute financial advice or advice of any kind. Coin Edition is not responsible for any losses incurred as a result of the utilization of content, products, or services mentioned. Readers are advised to exercise caution before taking any action related to the company.
 Price Prediction 2026, 2027, 2028, 2029, 2030-2050")


