


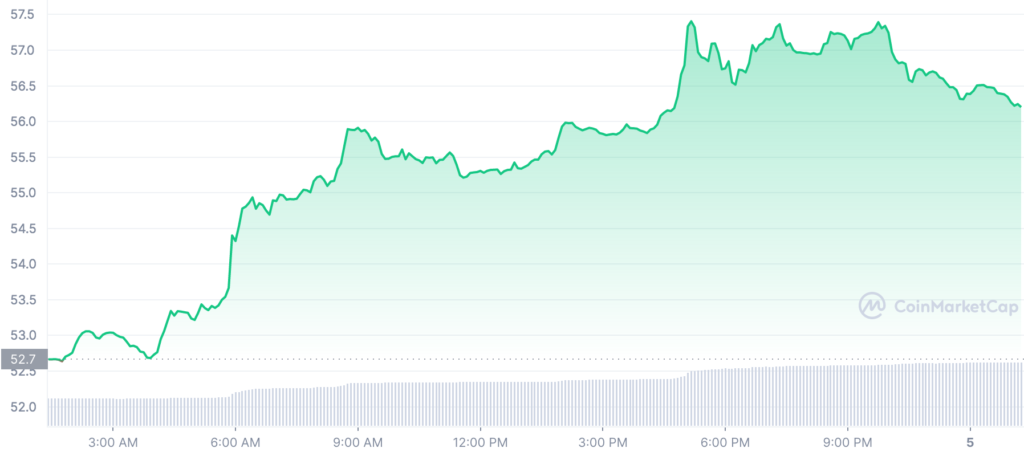
- Aave has been on a bullish trend for the past 24 hours taking the price to 55.78.
- Indicators show that the bulls have the potential to take Aave to $62.
- Bears have started looming on the 4-hour chart.
The bulls are currently in charge of the Aave (AAVE) market as the price trend has been trending upward for the past three days. Aave’s price increased by 0.96% to $56.43 because of the increase in demand.
Market capitalization and 24-hour trading volume rose after this bullish outburst. This is demonstrated by the market cap rising to $795.27M while the 24-hour trading volume has risen to $77.81M.
The three lines are moving upstream with open mouths, according to the Williams alligator, which denotes a positive trend. If prices soar beyond the alligator’s jaws, a continuation of this bull run is more likely.
As the top band reaches $57.4 and the lower band approaches $52.64, this indicates that the Bollinger Bands are expanding, indicating increased market volatility.
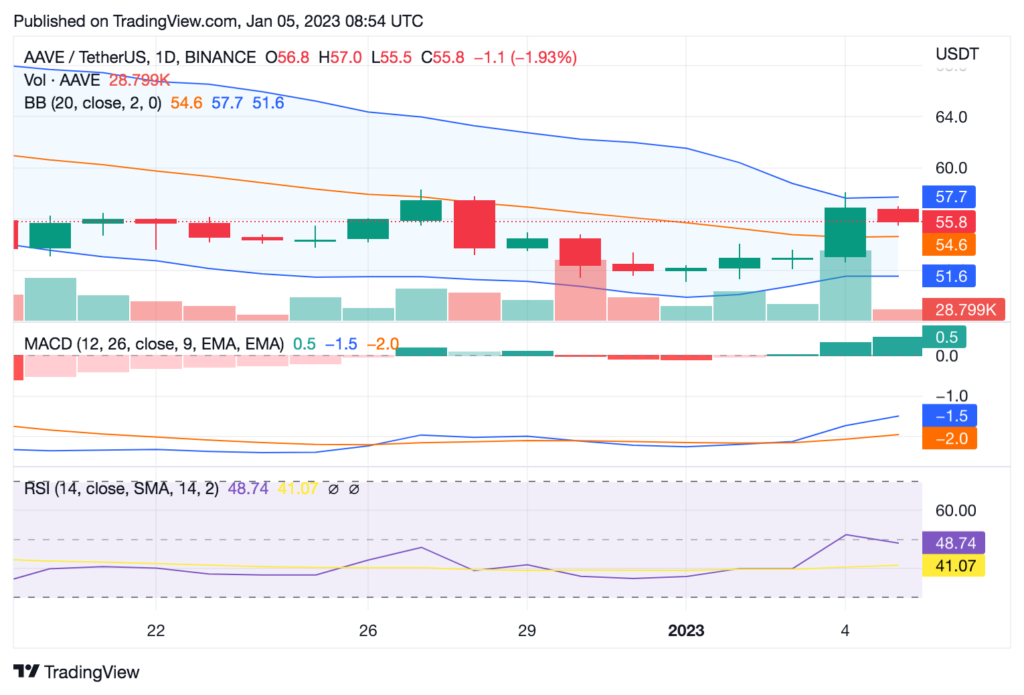
The market is going towards the overbought region as indicated by the relative strength index (RSI) indicator, which is now showing a reading of 48.74. The 200-day simple moving average is at $50.86, and the 50-day simple moving average is at $55, indicating that the cryptocurrency’s overall market sentiment is still favorable. The signal line of the MACD for AAVE is above zero, indicating that bulls have seized control of the market. The MACD for AAVE is likewise in a bullish zone.
Given that bulls have the advantage as indicated by the green engulfing candlestick and that growing volatility increases the likelihood of a breakout, a break over the resistance level is likely if bulls battle.
Additionally, there is a higher chance that this bull run will continue given the price action’s march towards the upper band. Technical analysis shows a bullish flag is present when the 9-day EMA is located above the 20-day EMA line. In the coming days, it appears nonetheless, that the 9-day EMA may cross bullishly above the 20-day EMA line.
If this occurs, the price of AAVE will advance past the resistance level described before and towards $62.
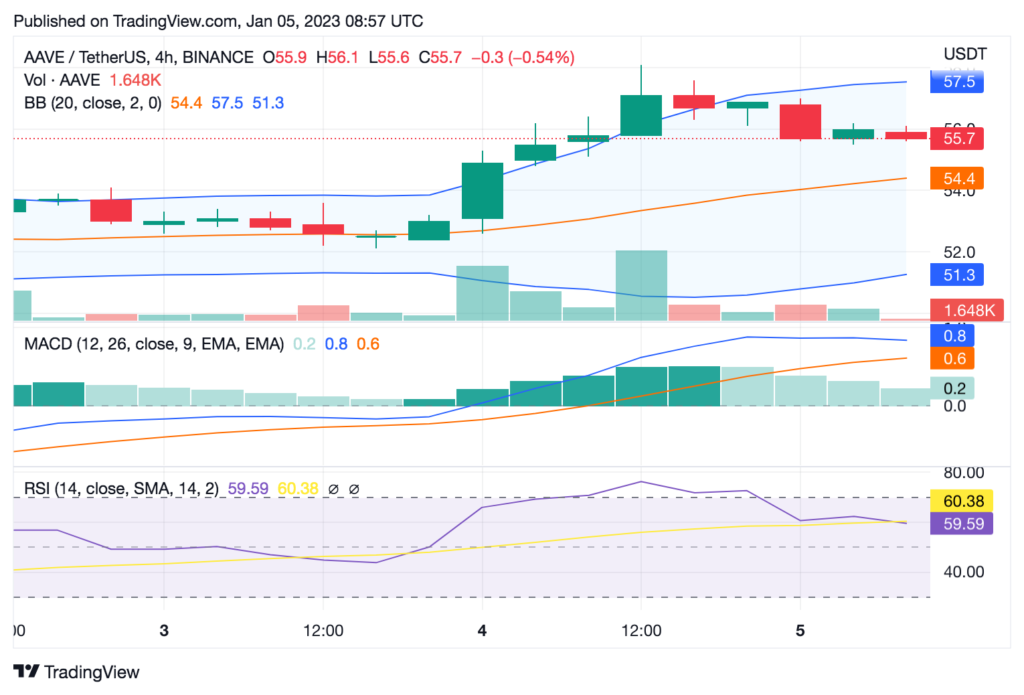
On the 4-hour chart, the bears have started to show signs of a market downtrend as they have been targeting AAVE price for the past few hours. Red candlestick indicators point to a short-term bearish market move, but if bulls can keep up their bullish tempo, a positive turnaround is still possible.
Disclaimer: The views and opinions, as well as all the information shared in this price analysis, are published in good faith. Readers must do their own research and due diligence. Any action taken by the reader is strictly at their own risk, Coin Edition and its affiliates will not be held liable for any direct or indirect damage or loss
Disclaimer: The information presented in this article is for informational and educational purposes only. The article does not constitute financial advice or advice of any kind. Coin Edition is not responsible for any losses incurred as a result of the utilization of content, products, or services mentioned. Readers are advised to exercise caution before taking any action related to the company.
: What Happens If You Use an Unlicensed Platform?")


