


- Ali Martinez revealed that a descending triangle has formed on ADA’s 30 minute chart.
- The analyst predicted that ADA could soon surge to $0.70.
- Martinez added that ADA’s bullish momentum will be dampened if it shows weakness around $0.613.
Ali Martinez, a renowned cryptocurrency trader and analyst, revealed in an X post yesterday that a descending triangle has formed on the thirty minute chart for Cardano (ADA). Although this is a bearish pattern, the analyst predicted that it could lead to ADA soaring to $0.700 if it manages to sustain a position above $0.638.
Martinez did, however, urge traders to keep a close eye on the $0.613 support level. ADA showing any signs of weakness at this level may “dampen” ADA’s bullish momentum, added the analyst.
Over the past 24 hours, ADA was trading slightly below the key support level highlighted in the analyst’s tweet. According to CoinMarketCap, the altcoin was down 3.71%. This brought its price down to $0.6123. Despite this 24-hour loss, ADA was still up more than 3% on the weekly timeframe.
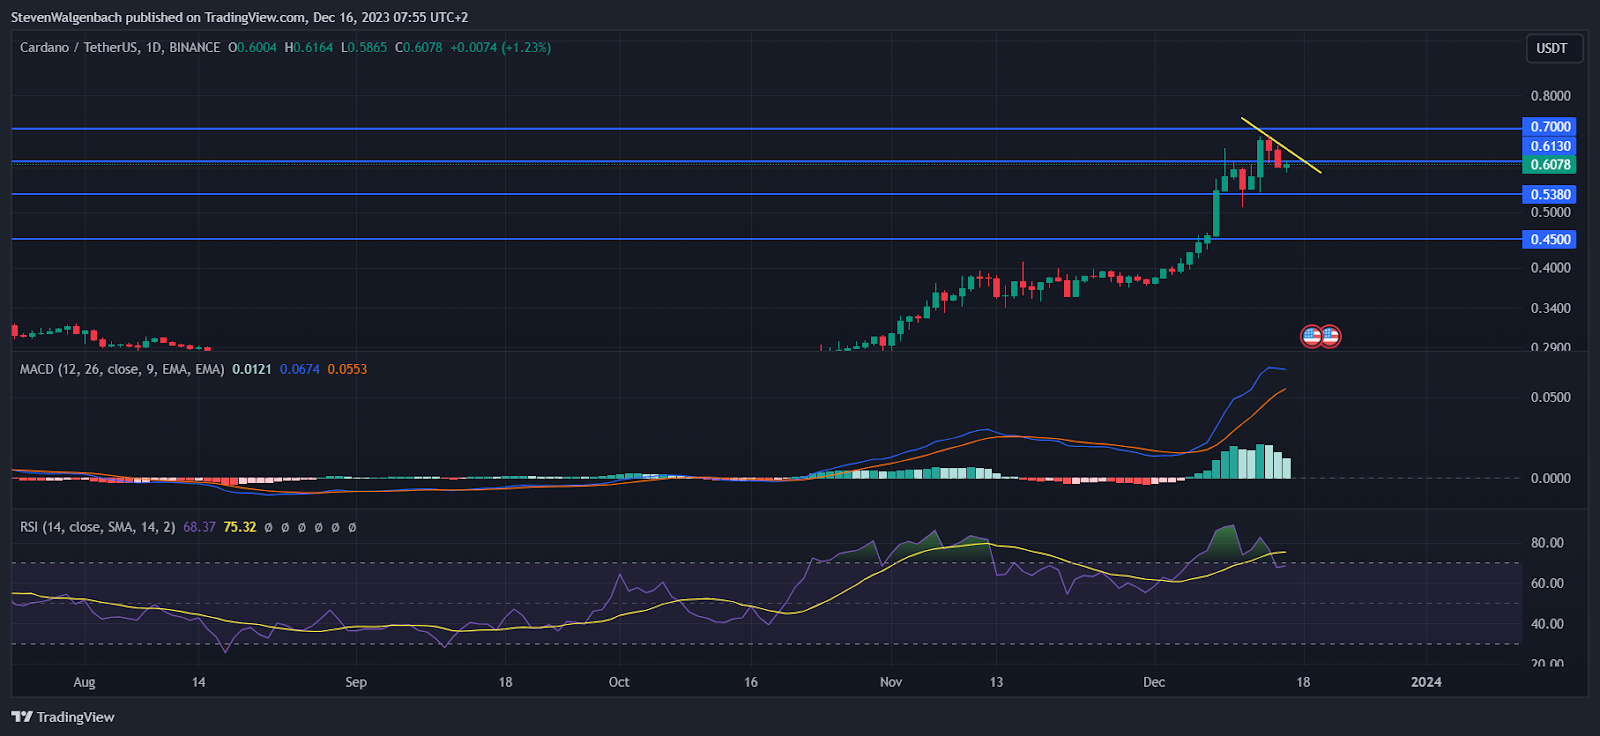
Looking at the daily chart, ADA has dropped below the base of the descending triangle. This exposes it to the risk of a continued drop towards $0.5380 in the next 48 hours. Thereafter, continued sell pressure could force the altcoin’s value down to as low as $0.45 in the short term.
This bearish thesis may be invalidated if ADA closes a daily candle above the $0.613 mark in the next 48 hours. In this more bullish scenario, the cryptocurrency may rise towards the $0.7 threshold in the following few days.
Technical indicators on ADA’s daily chart were flagging bearish. Both the Relative Strength Index (RSI) and the Moving Average Convergence Divergence (MACD) indicators suggested that sellers have grown stronger than buyers in the last 48 hours.
The RSI line also broke below the RSI Simple Moving Average (SMA) line during the last few days. This is a significant bearish technical flag that signals that bears have gained the upper hand against buyers. Meanwhile, the slope of the MACD Histogram was negative, which may be a sign of ADA’s bearish trend continuing in the next few days.
Disclaimer: The information presented in this article is for informational and educational purposes only. The article does not constitute financial advice or advice of any kind. Coin Edition is not responsible for any losses incurred as a result of the utilization of content, products, or services mentioned. Readers are advised to exercise caution before taking any action related to the company.
 Price Prediction 2026, 2027, 2028, 2029, 2030-2050")


