
- XRP fell 1.29% to $1.0476 on August 6, breaking below triangle support with the Bollinger Band at $1.0362 as the last floor before $1
- Spot XRP ETFs logged a $3.58M outflow on August 5, the first negative session since July 8, with Bitwise absorbing the full loss
- Evernorth’s Chief Business Officer argued XRP should be judged by what it enables, not what it trades at
XRP breaks below its triangle support on August 6, dropping 1.29% to $1.0476 with only the Bollinger Band lower boundary at $1.0362 standing between current price and the $1 floor.
XRP Breaks the Triangle With the Bollinger Band as the Last Line
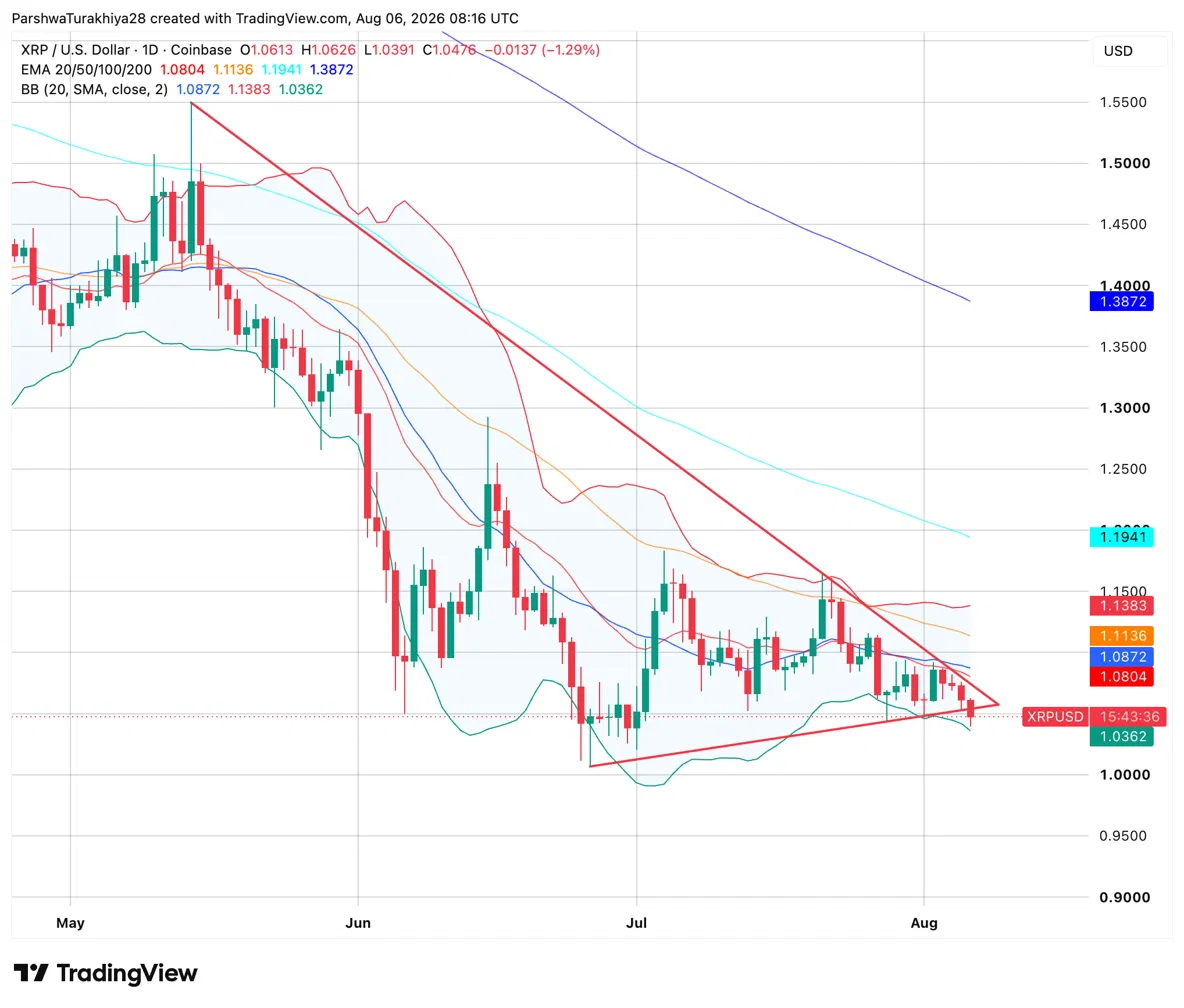
The daily chart shows XRP breaking below the lower trendline of a triangle pattern that has been forming since the May highs above $1.50. Both trendlines slope downward and have been converging for months, with the lower trendline providing support on multiple tests through June and July. Today’s session broke that support decisively, opening at $1.0613, pushing briefly to $1.0626, then sliding to a low of $1.0391 before settling at $1.0476.
A descending wedge breaking downward through its lower support is a bearish continuation signal, suggesting the trend that has been in place since May is not yet finished. The Bollinger Band lower boundary at $1.0362 is the only meaningful technical floor remaining between current price and the $1 round number. A daily close below $1.0362 would remove that last layer and bring $1 directly into play.
Related: PI Price Prediction: Can Pi Network Sustain Its Rally as 127.5M PI Unlock Approach?
All four EMAs slope downward above price. The 20-day at $1.0804 aligns with the Bollinger Band midline at $1.0872, making that zone the first resistance cluster any recovery attempt needs to clear. Above that, the 50-day at $1.1136 and the Bollinger Band upper boundary at $1.1383 form the next layer of overhead resistance.
XRP Support and Resistance Levels, August 6, 2026
| Type | Price | Level |
| Resistance | $1.0804 | 20-day EMA, aligns with Bollinger midline |
| Resistance | $1.1136 | 50-day EMA |
| Resistance | $1.1383 | Bollinger Band upper boundary |
| Resistance | $1.1941 | 100-day EMA |
| Support | $1.0362 | Bollinger Band lower boundary, last floor |
| Support | $1 | Round number and psychological floor |
Spot XRP ETFs Log First Outflow Since July 8
Spot XRP ETFs recorded a $3.58M daily net outflow on August 5, the first negative session since July 8 according to SoSoValue. Bitwise’s XRP product absorbed the entire outflow, losing $3.58M on the day. All other products recorded zero flow. Cumulative net inflows across all five products hold at $1.51B with total net assets at $993.38M, just below the $1B mark.
The outflow interrupts what had been a steady, if modest, run of positive or flat daily flows through most of July. It arrives in the same session as the triangle breakdown, adding a flow-level confirmation to the bearish technical signal.
| ETF | Sponsor | Aug 5 Flow | Cumulative Inflow |
| XRP | Bitwise | -$3.58M | $507.33M |
| XRPZ | Franklin | $0 | $425.97M |
| XRPC | Canary | $0 | $468.12M |
| TOXR | 21Shares | $0 | -$20.06M |
| GXRP | Grayscale | $0 | $131.46M |
Evernorth: Stop Judging XRP by Price
Evernorth Chief Business Officer Sagar Shah published a detailed thread on August 5 arguing that XRP is being evaluated by the wrong metric. Shah’s case is that price is the easiest thing to see in a digital asset, constantly updated and easy to compare, but that it tells only a fraction of the story for an asset built to move value across currencies, markets, and financial systems.
Related: Cardano Price Prediction: ADA Futures Up 380% in a Week — Is the Big Move Finally Coming?
Shah identified four areas where XRP’s utility is the more relevant measure: liquidity provision, settlement infrastructure, lending, and tokenized assets. His framing cuts directly against the current price weakness narrative. The better question, Shah argued, is not what XRP is worth today but what XRP can make possible, and the more meaningful indicator is how the asset is actually being used rather than how it trades on any given session.
Derivatives: Volume Surges but Longs Are Taking the Pain
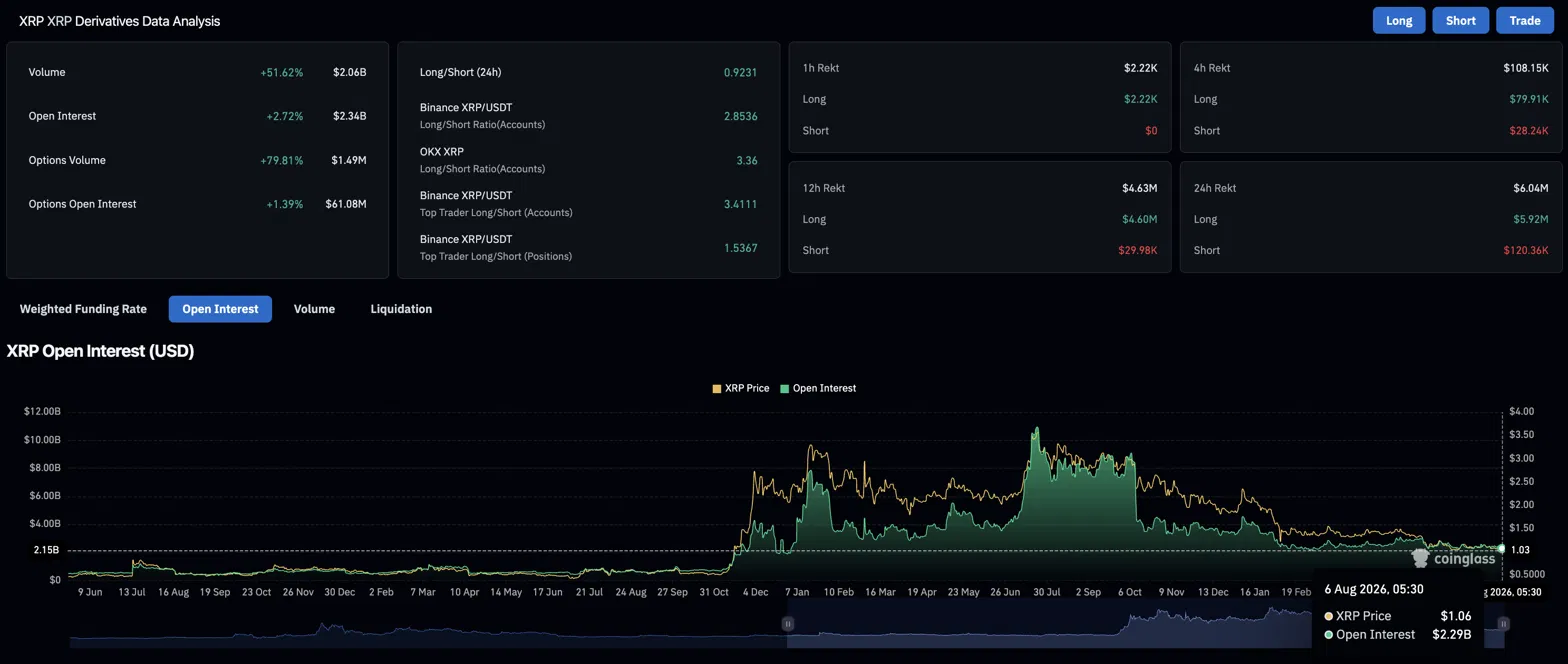
Volume jumped 51.62% to $2.06B while open interest rose 2.72% to $2.34B. Rising volume and open interest together point to fresh positioning entering the market, but the liquidation data shows which side is absorbing the damage. Over 24 hours, longs were liquidated for $5.92M against just $120.36K for shorts, meaning the buyers in this trade are taking nearly all the pain as the triangle breaks lower.
Account-level ratios remain skewed long despite the breakdown. Binance retail sits at 2.8536, OKX at 3.36, and Binance’s top trader accounts at 3.4111, with position sizing at 1.5367. The divergence between bullish positioning and bearish price action is the key tension in the current setup, and it is the longs who are being squeezed.
| Metric | Value | Interpretation |
| 24h Volume | $2.06B (+51.62%) | Sharp rise in activity around the breakdown |
| Open Interest | $2.34B (+2.72%) | Fresh positions being added |
| Long/Short Ratio (24h) | 0.9231 | Slightly net short overall |
| Top Trader L/S (Accounts) | 3.4111 | Large accounts heavily net long |
| 24h Liquidations | $6.04M | Longs absorbed nearly all the pain |
XRP Price Prediction: Upside and Downside Targets
Bullish Case, Target: $1.1136 (50-day EMA)
The Bollinger Band lower boundary at $1.0362 holds on a daily close, containing the triangle breakdown as a false break. Volume dries up and XRP recovers back above the broken trendline, with Evernorth’s utility narrative drawing fresh institutional attention. The 20-day EMA at $1.0804 clears on a daily close and price pushes toward the 50-day at $1.1136 as short liquidations accelerate the move.
Bearish Case, Risk Level: $1 (Round Number Floor)
The Bollinger Band lower boundary at $1.0362 fails to hold and the triangle measured move target pulls price toward $1. ETF outflows extend beyond a single day and longs continue absorbing liquidations without a catalyst to reverse sentiment. The $1 round number becomes the next test, the last meaningful floor before price enters territory not seen since the pre-2026 recovery.
Related: Bitcoin Price Prediction: BTC Cup and Handle Targets $70K as ETF Inflows Cross $626M This Week
Disclaimer: The information presented in this article is for informational and educational purposes only. The article does not constitute financial advice or advice of any kind. Coin Edition is not responsible for any losses incurred as a result of the utilization of content, products, or services mentioned. Readers are advised to exercise caution before taking any action related to the company.