


- A close below the 20 EMA, which was at $0.70, could drag ADA further down.
- On-chain metrics indicated a healthy Cardano network, suggesting a short-term recovery.
- Bulls no longer dominated XRP’s price action as the next target could be close to $0.54.
Cardano’s (ADA) price rallied to $0.76 on March 2 as altcoins in the market continued to jump. The uptrend meant ADA’s value had increased by 21.89% in the last seven days. Ripple (XRP) also registered a similar performance as the price reclaimed $0.62.
However, ADA’s upswing had slowed down at press time. According to the 4-hour ADA/USD chart, the value decreased by 1.98% in the last 24 hours. An in-depth analysis of the price revealed that ADA faced a barrier at $0.69.
But bulls were able to push above the resistance by banking on the $0.67 support when the price retraced. As of this writing, ADA’s price has decreased to $0.71. However, the Exponential Moving Average (EMA) indicated that the token could experience another upswing.
ADA Is Caught In Between the Sticks
At press time the 9 EMA had flipped the 20 EMA (yellow), suggesting a bullish trend. However, traders might need to watch as ADA had slipped below the 9 EMA. If the price falls below $0.70 where the 20 EMA was, the bullish thesis might be invalidated.
In this instance, ADA could nosedive toward $0.63. On the other hand, a close above $0.72 could reinforce the bullish bias initially mentioned.
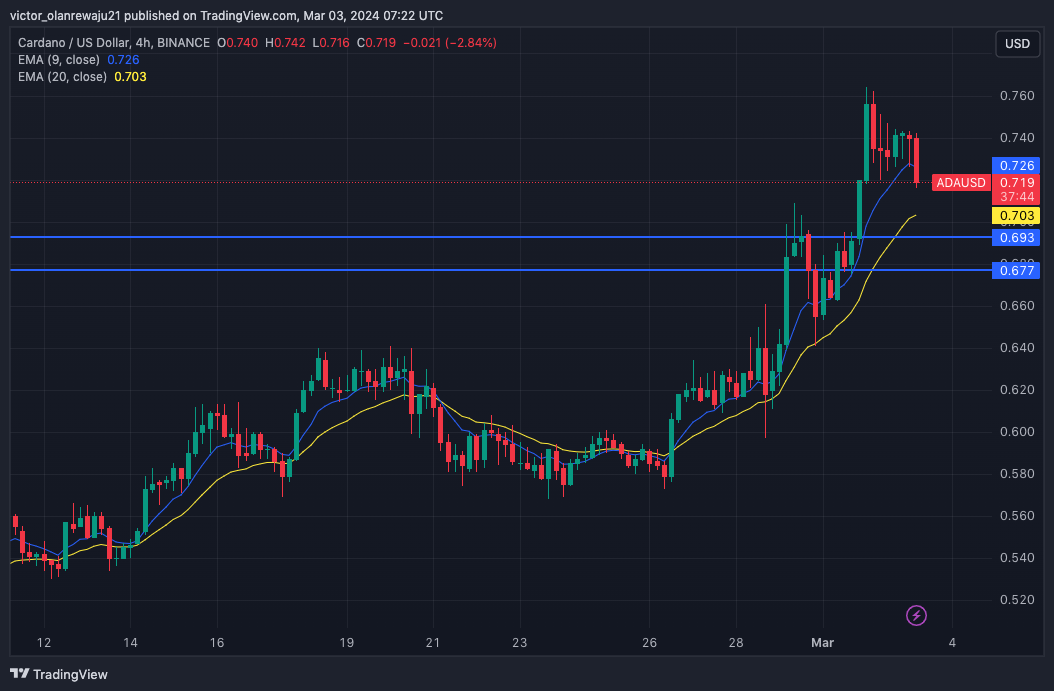
From an on-chain perspective, analyst Ali Martinez opined that ADA’s price might continue to grow. According to Martinez, the hike in transactions, active addresses, and volume meant that Cardano’s network was healthy.
Thus, a healthy network alongside demand could foster higher prices. Should this be the case going forward, ADA could eye a run toward $0.90.
XRP Paves the Way for Bears
The XRP/USD 4-hour chart displayed a sharp bearish candle as the token nosedived to $0.60. A trend like this suggests that bulls were no longer in controlling price action. This sentiment reflected in the Relative Strength Index (RSI).
Previously, the RSI reading hit 72.00, indicating that XRP was overbought. However, the decline to 53.41 was proof that bears had come in. If XRP slides to $0.58, the next target could see the price continue a decline toward $0.54.
However, the Moving Average Convergence Divergence (MACD) showed that XRP has the potential to recover. At press time, the MACD reading was positive. However, traders need to keep an eye on the 12-day EMA (blue) and 26-day EMA (orange).
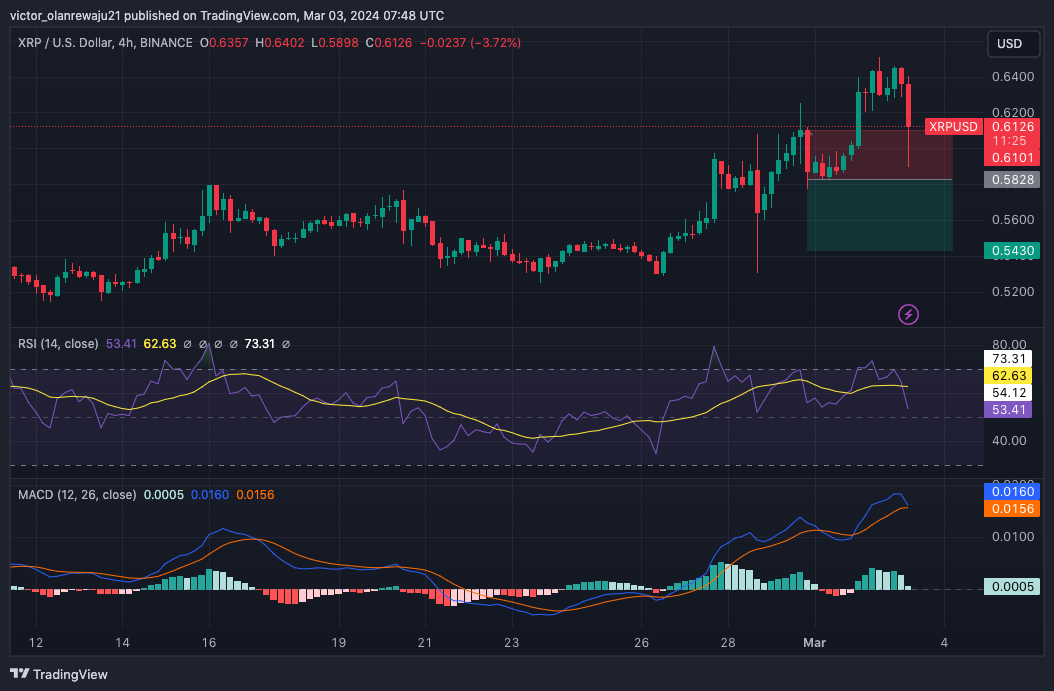
If the longer EMA flips the shorter one, then it would imply that sellers are dominant. This could lead XRP to fall to $0.54. On the other hand, if the 12 EMA crosses over the 26 EMA, then XRP might retest $0.62.
Disclaimer: The information presented in this article is for informational and educational purposes only. The article does not constitute financial advice or advice of any kind. Coin Edition is not responsible for any losses incurred as a result of the utilization of content, products, or services mentioned. Readers are advised to exercise caution before taking any action related to the company.


 Price Prediction 2026, 2027, 2028, 2029, 2030-2050")

