


 Exhibits a Bullish Flag but Bears Still Loom")
- Bullish trend takes over the ALGO 24-hour chart.
- Bears struggle to reverse the ALGO market.
- Technical indicators show the bullish trend will continue in the short term.
Today’s market has been controlled by Algorand bulls, with bears’ attempt to drive prices lower unsuccessful after they brought prices to an intraday low of $0.1695. The price of ALGO climbed to $0.1712 as a result of the rise in demand.
Indicating significant buying activity, the market cap jumped by 2.04% to $30,513,774 while the 24-hour trading volume increased by 4.21% to $30,513,774.
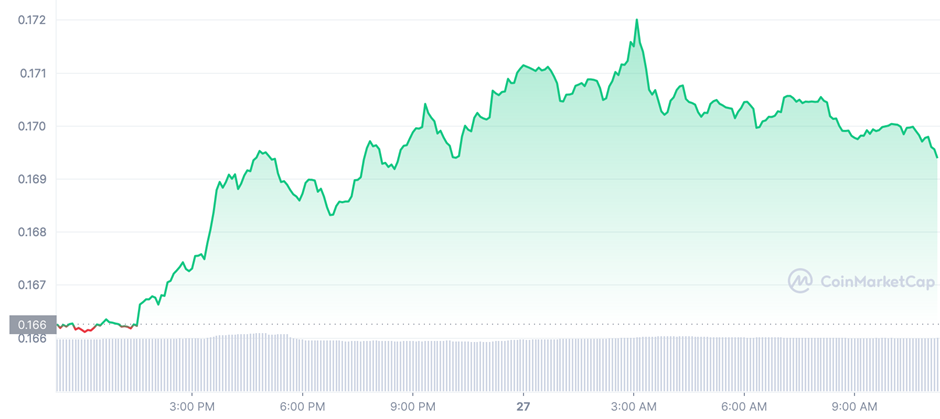
On the ALGO price chart, a green engulfing candlestick signals the market’s upward momentum will continue. This notion is supported by the ROC curve’s increased slope near the $0.17 level. Investors may be more certain that the price will increase the higher it is directed.
A “strong buy signal” from the Technical Rating indicator suggests that ALGO’s upward trend is likely to continue. The technical ratings now have a positive rating and are in the positive territory, supporting the bullish premise underpinning the ALGO market.
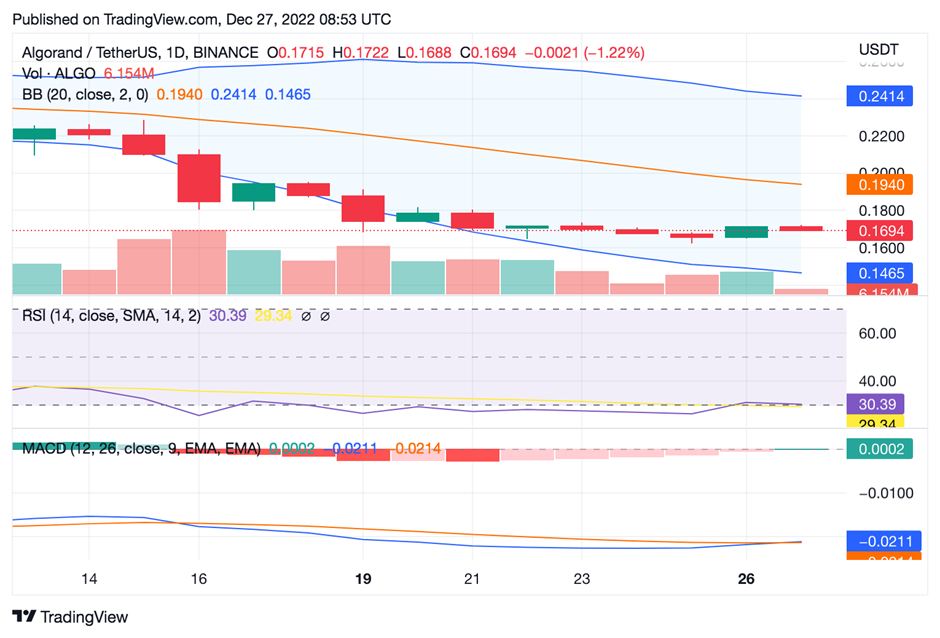
The Moving Average Convergence Divergence (MACD) is heading higher and in the positive range, with a value of -0.0214. Also, the MACD blue line going above the signal line shows that ALGO is likely to keep going in a positive direction.
Increased selling and buying activity is indicated by the bulging Bollinger Bands. The market is rising up above both zones, which indicates that bulls are growing stronger, adding to the present positive sentiment in the market. A potential bullish trend can be seen when the top band reaches $0.2408 and the bottom band reaches $0.147.
Bullish momentum is present when the 5-day moving average (MA) of the ALGO market crosses above the 20-day MA. The 5-day MA’s value of 0.17 and the 20-day MA’s (1-hour) value of 0.169 on the price chart both reflect this. A bullish engulfing candlestick’s appearance also signals that the current bull trend may persist in the foreseeable future.
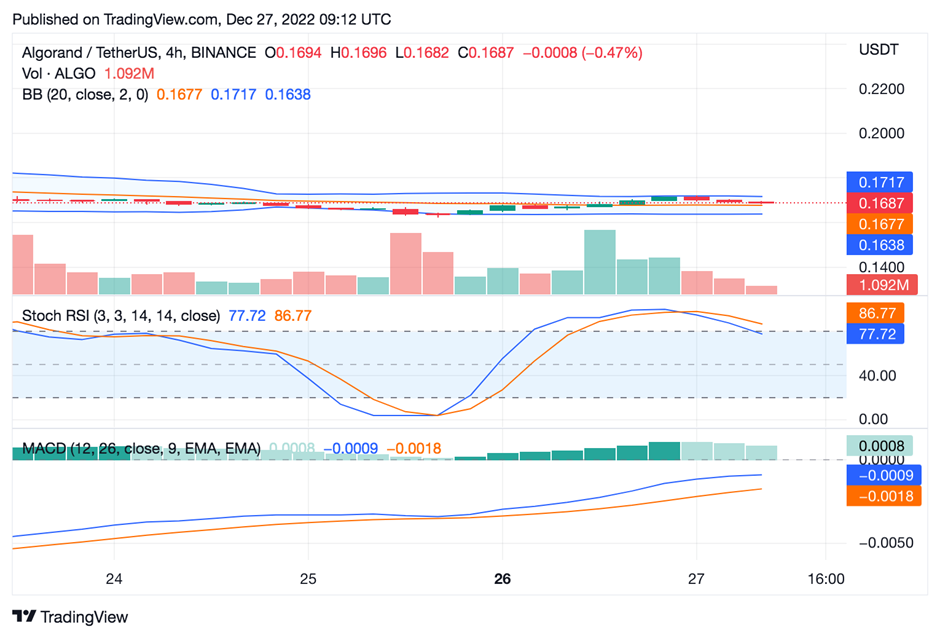
On the 4-hour price chart, Bollinger Bands are enlarging and moving upward, signaling increased market volatility. The Bollinger Bands’ upper limit of $0.1721 and lower limit of $0.1639 show a bullish outlook. More support for this bullish trend is offered by price action that is on the verge of crossing above the top band.
Disclaimer: The views and opinions, as well as all the information shared in this price prediction, are published in good faith. Readers must do their research and due diligence. Any action taken by the reader is strictly at their own risk. Coin Edition and its affiliates will not be held liable for any direct or indirect damage or loss.
Disclaimer: The information presented in this article is for informational and educational purposes only. The article does not constitute financial advice or advice of any kind. Coin Edition is not responsible for any losses incurred as a result of the utilization of content, products, or services mentioned. Readers are advised to exercise caution before taking any action related to the company.
 Price Prediction 2026, 2027, 2028, 2029, 2030 -2050")


