
- Technical indicators suggest WOO, SUSHI, THETA, LINK, FET, COTI, MATIC, and OCEAN may rise in the coming weeks.
- A significant bullish technical flag was triggered on THETA’s daily chart over the past 2 weeks.
- LINK may be on the verge of a breakout as a symmetrical triangle pattern has emerged on its daily chart.
As the year comes to an end, several altcoins are showing signs of strong moves to the upside in the next few weeks. Specifically, Ocean Protocol (OCEAN), Sushiswap (SUSHI), Theta Network (THETA), WOO Network (WOO), Chainlink (LINK), Fetch.ai (FET), COTI and Polygon (MATIC) show signs of upcoming gains.
Ocean Protocol (OCEAN)
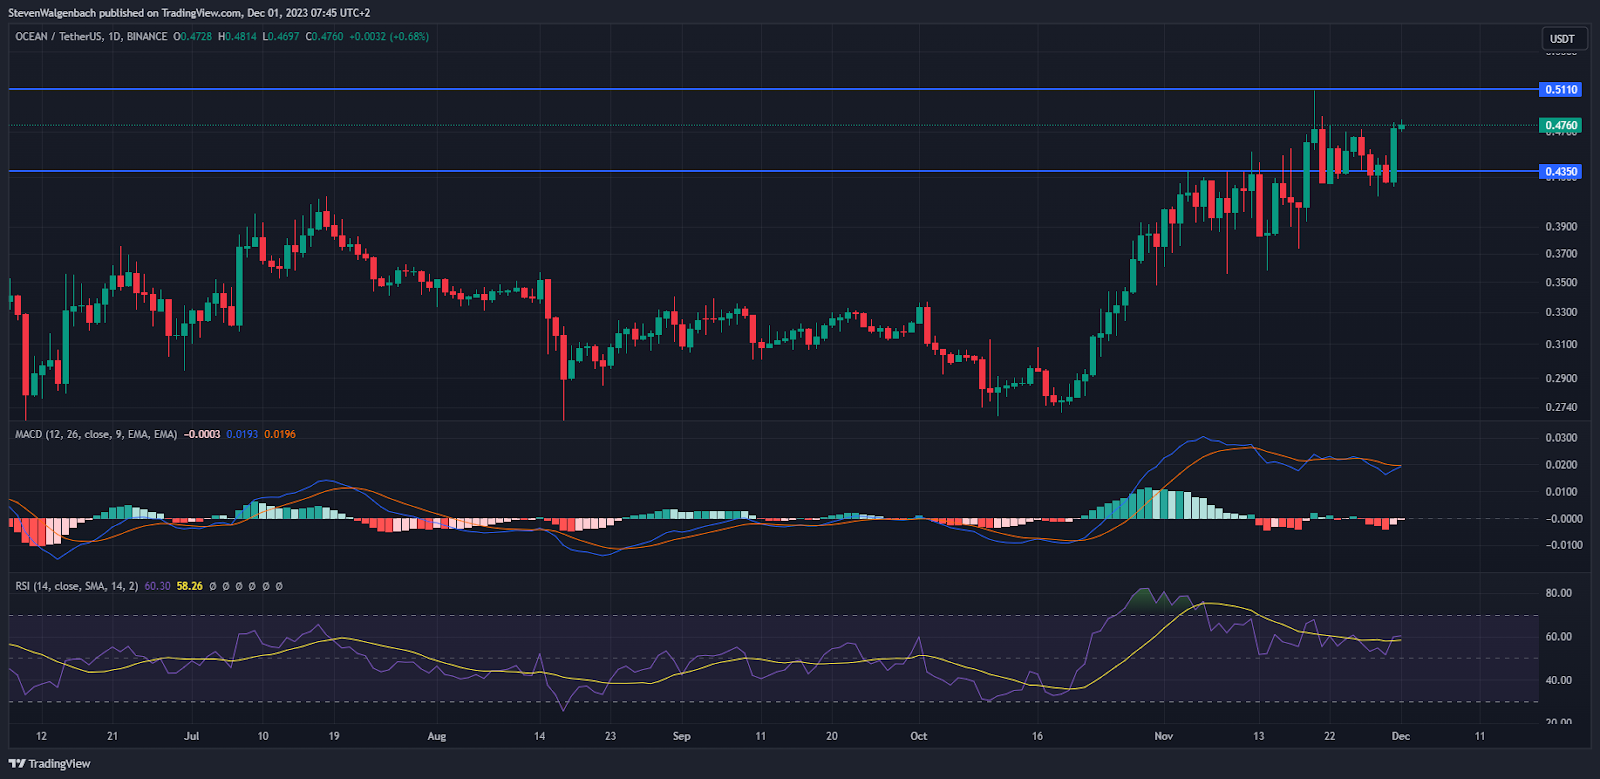
Technical indicators were flagging bullish for OCEAN after it was able to break above the $0.4350 resistance level over the past 48 hours. Both the Moving Average Convergence Divergence (MACD) and the Relative Strength Index (RSI) indicators suggested that the altcoin’s price may rise.
With the RSI line positioned above the RSI Simple Moving Average (SMA) line, buyer strength seems to have increased. Meanwhile, the MACD line was attempting to break above the MACD Signal line, which may suggest a continuation of OCEAN’s bullish trend.
If these technical flags are validated, OCEAN may attempt to break above $0.5110 in the next few days. On the other hand, the altcoin’s value could retest the immediate support level at the aforementioned $0.4350 mark if traders begin to take profit.
SushiSwap (SUSHI)
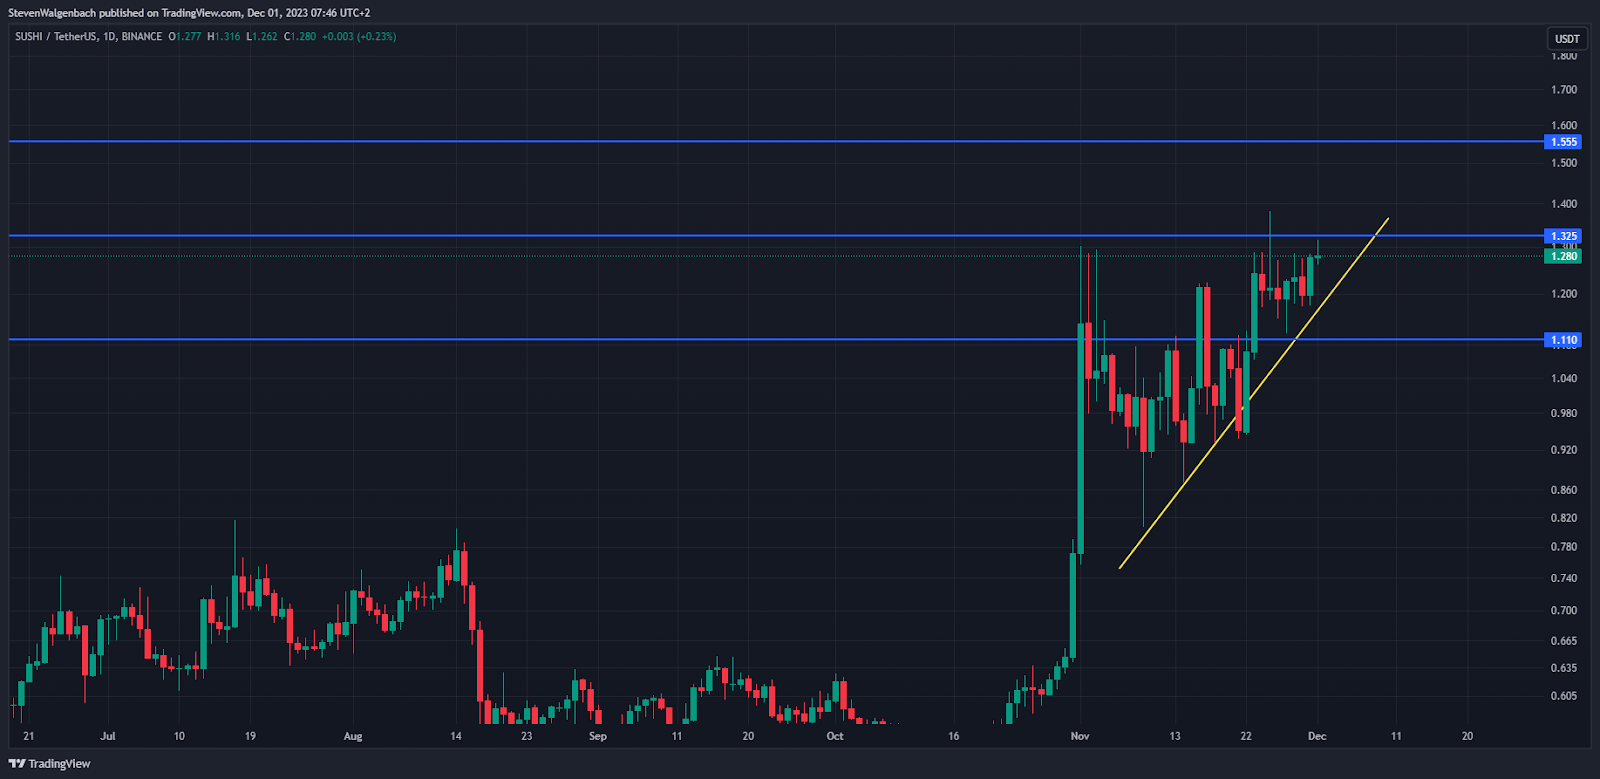
A bullish ascending triangle has emerged on SUSHI’s daily chart after the altcoin’s price printed a series of higher lows over the past 2 weeks. This chart pattern led to the altcoin breaking above the $1.110 barrier and could guide it to above $1.325 as well in the next few days.
If SUSHI is able to close a daily candle above $1.325, then it may have the foundation needed to continue climbing to the subsequent resistance level. In this bullish scenario, the altcoin may rise to as high as $1.555. However, rejection from the $1.325 threshold within the next 2 days could lead to SUSHI retracing to $1.110 in the short term.
Theta Network (THETA)
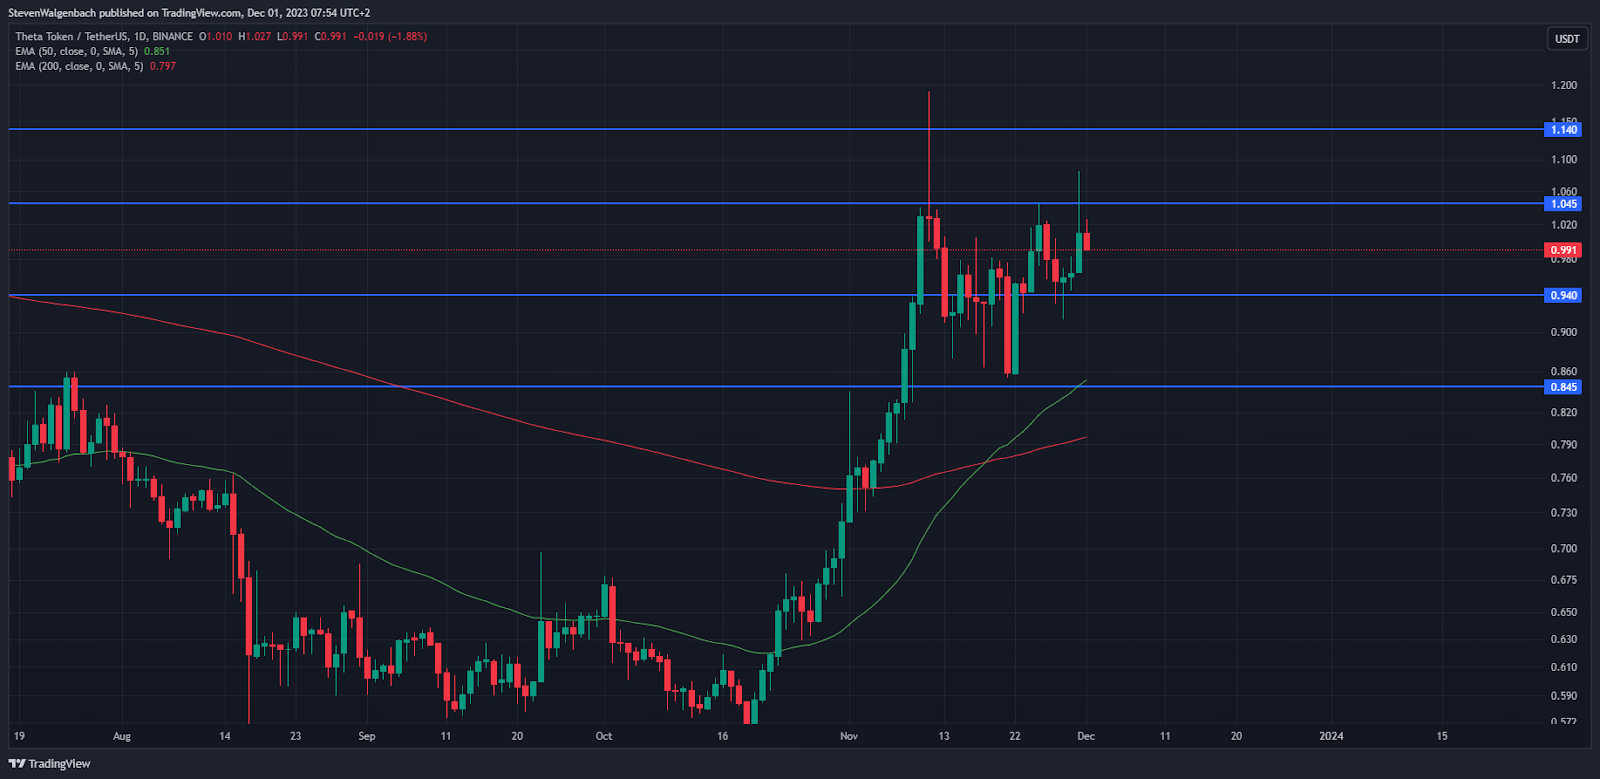
A significant bullish technical flag was triggered on THETA’s daily chart over the past 2 weeks. During this period, the 50-day Exponential Moving Average (EMA) line crossed above the 200-day EMA line. This suggests that long-term momentum has shifted in favor of bulls.
If buyers continue to elevate THETA’s price, then it could break above $1.045 before potentially rising to as high as $1.140 in the following few days. This bullish thesis may be invalidated if THETA fails to close a daily candle above $1.045 in the next 72 hours.
In this more bearish scenario, the cryptocurrency’s value could retrace to the $0.940 support level. Continued sell pressure could then drag the altcoin’s value below this mark to as low as $0.845 in the short term.
WOO Network (WOO)
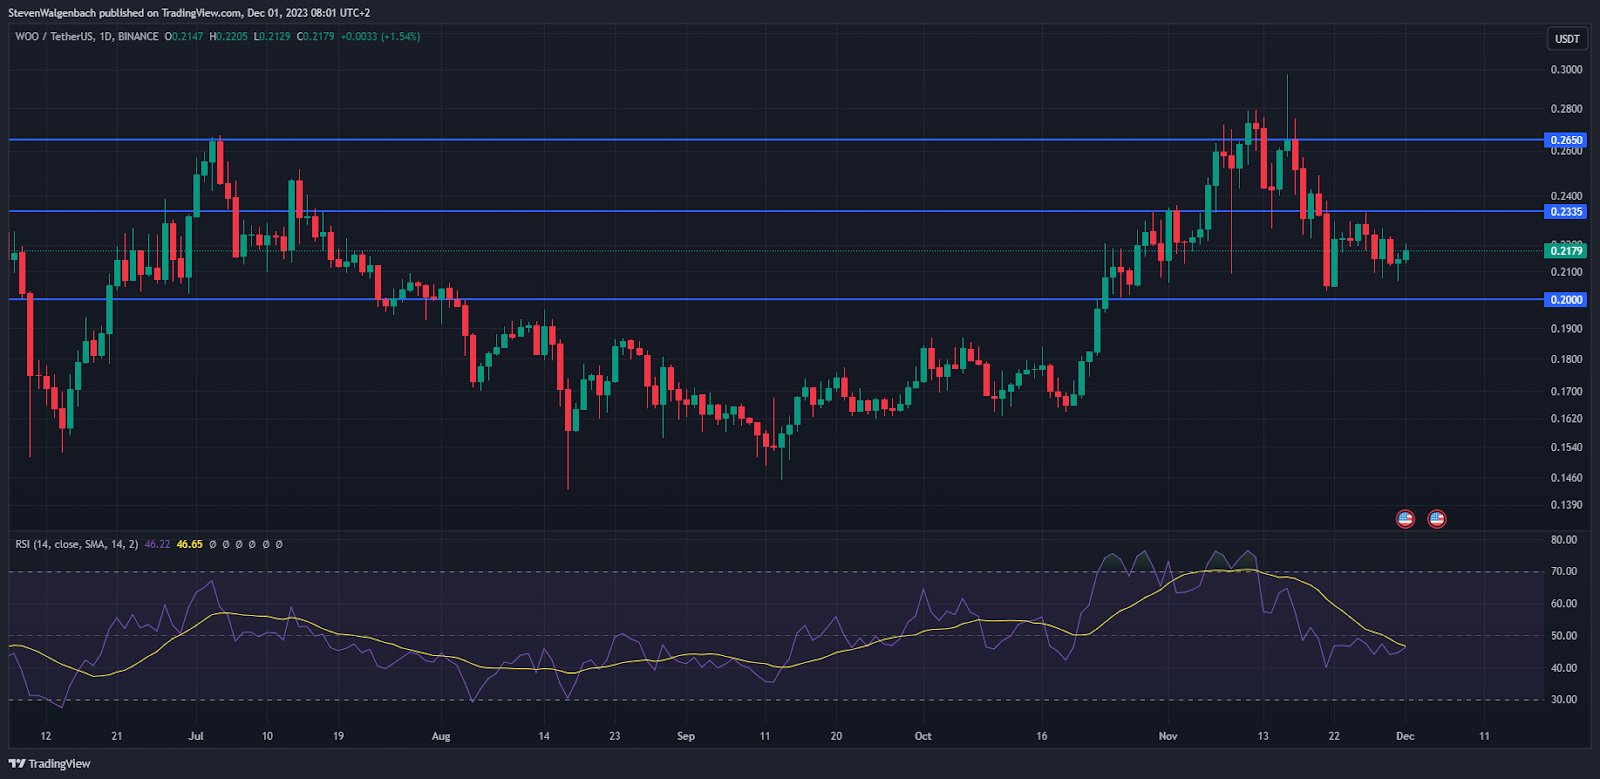
WOO has been in a gradual negative trend over the past week but the current green daily candle suggests that it may have broken this bearish cycle. Supporting this bullish thesis is the noteworthy technical flag that was on the cusp of being triggered. Specifically, the daily RSI line was attempting to cross the RSI SMA line at press time.
This suggests that buyers have re-entered WOO’s chart and may drive its price up in the coming few days. If this bullish flag is validated, then the altcoin’s value may rise to as high as $0.2335 in the short term. Thereafter, continued buy pressure could elevate WOO to the next major resistance level at $0.2650.
If the bullish technical flag is not confirmed and validated in the next 48 hours, then WOO may be at risk of retesting the immediate support level. In this more bearish scenario, its value may fall to as low as $0.2.
Chainlink (LINK)
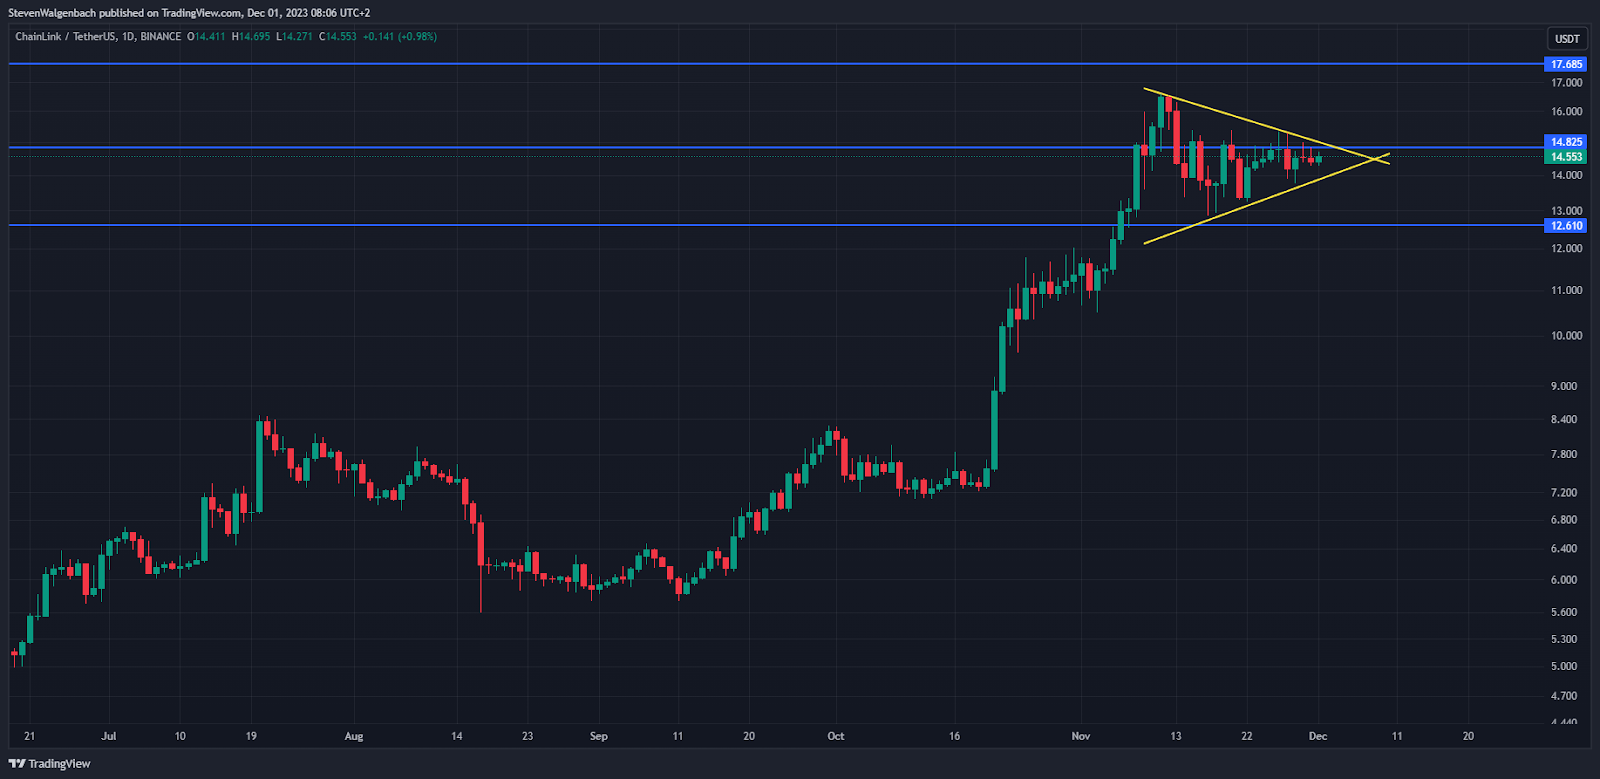
LINK may be on the verge of a breakout as a symmetrical triangle pattern has emerged on its daily chart. If the altcoin makes a move towards the upside in the short term, then it may break above $14.825. A sustained position above this barrier could then give LINK the support needed to soar to the subsequent resistance level at $17.685.
Conversely, a negative breakout could lead to LINK falling to the closest support level. This may result in the cryptocurrency retracing to as low as $12.610 in the next couple of days.
Fetch.ai (FET)
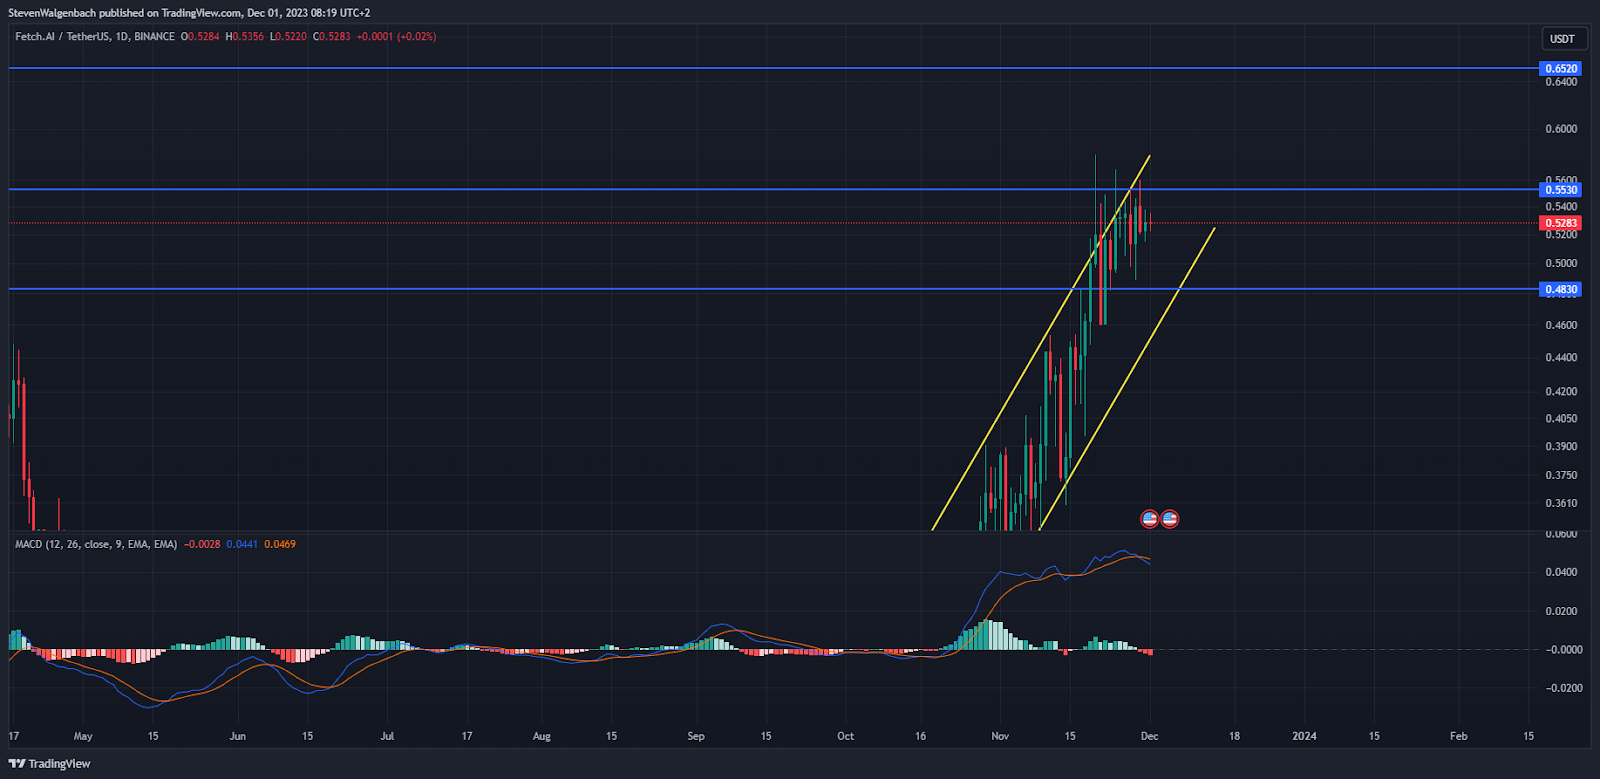
FET was rejected by the $0.5530 resistance level over the past few days, leading to the altcoin entering a consolidation phase. The MACD line also broke below the MACD Signal line, indicating the threat of a potential bearish trend reversal.
Nevertheless, the altcoin was still trading in a strong positive price channel that formed on its daily chart throughout the last few weeks. FET may begin another leg up should buyers decide to drive its price higher. If this bullish thesis is validated, then the cryptocurrency’s value may rise to above $0.5530 to potentially reach as high as $0.6520.
This bullish thesis may be invalidated if FET does not close a daily candle above $0.5530 in the next 72 hours. Consequently, the altcoin could be at risk of correcting down to the $0.4830 support level.
COTI (COTI)
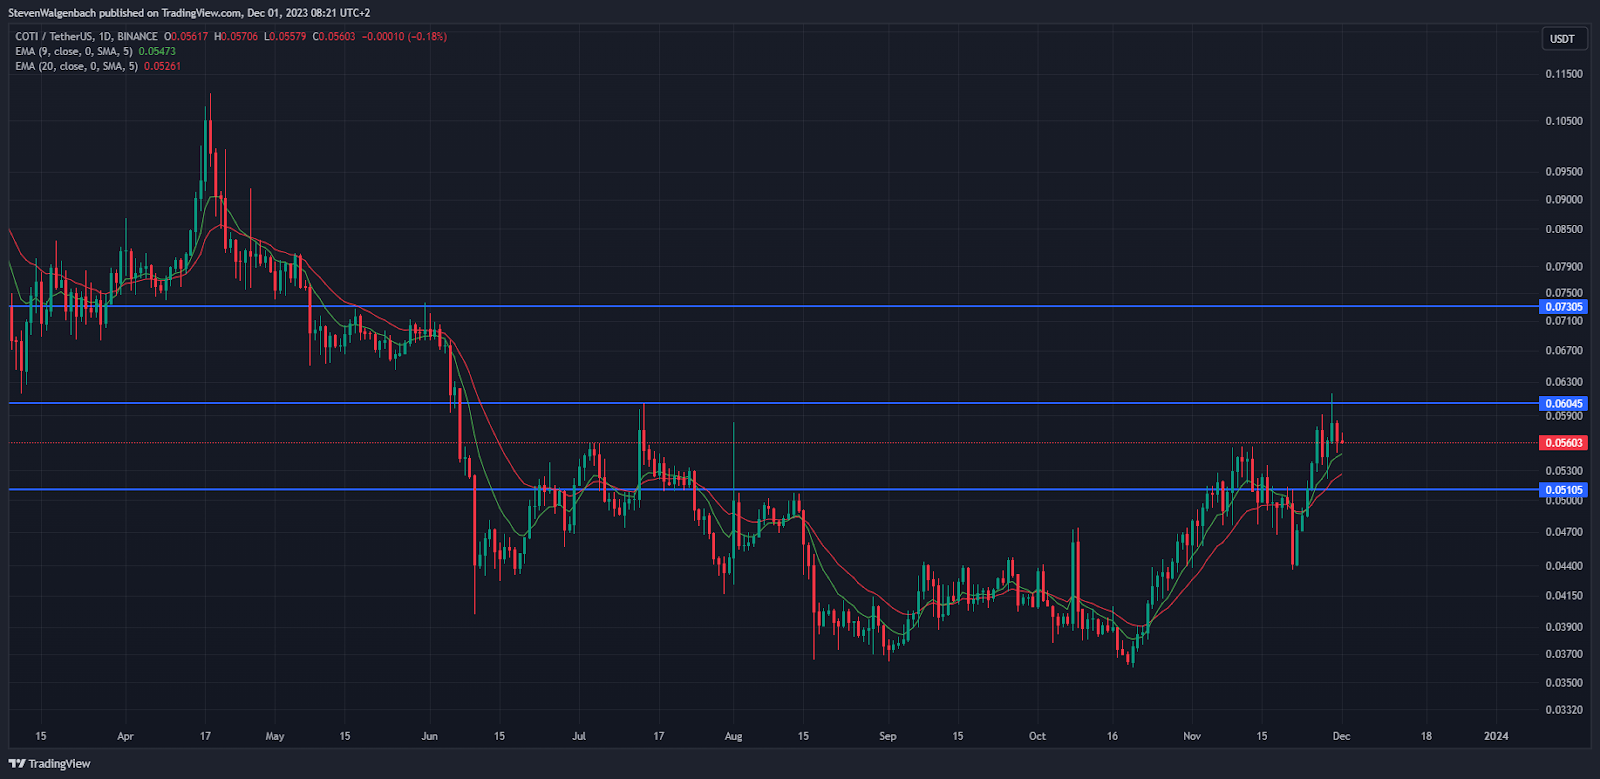
Short-term momentum for COTI seemed to be in favor of bulls. This was indicated by the 9-day EMA line, which was positioned above the 20-day EMA line. If this momentum continues, the altcoin’s price may flip the $0.06045 resistance level into support. This may then give COTI the foundation needed to embark on a journey towards $0.07305 in the following few weeks.
This bullish thesis may be invalidated if COTI breaks below the 9-day EMA line in the next 48 hours. In this bearish scenario, the altcoin’s value could drop below the 20-day EMA line as well before potentially retesting the $0.05105 support level.
Polygon (MATIC)
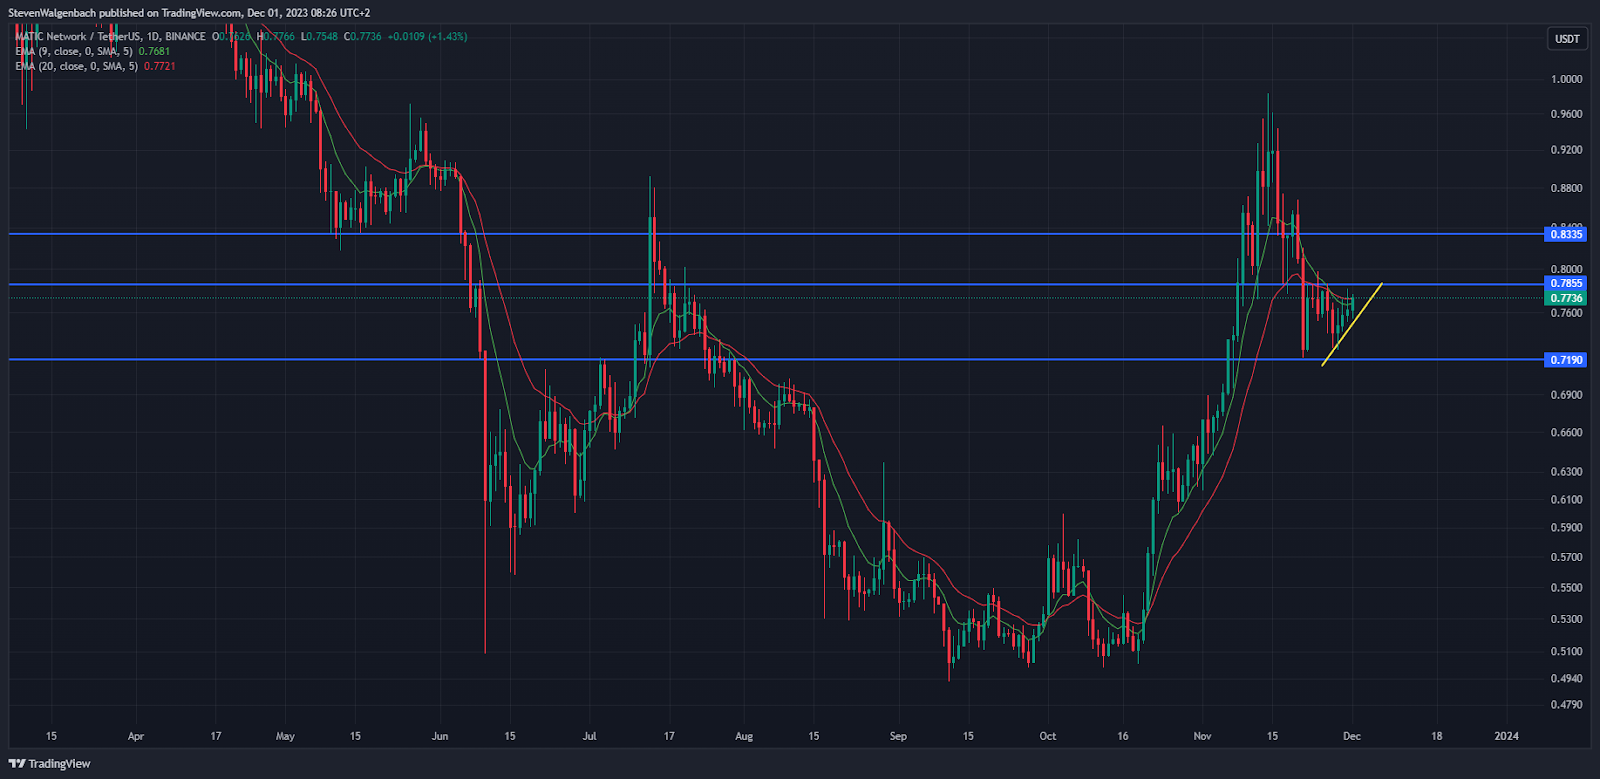
MATIC enjoyed a multi-day positive sequence over the past 4 days – leading to the formation of a positive trend line. If this strong bullish momentum continues, then MATIC may attempt to flip the $0.7855 resistance level into support. This could then clear a path for the altcoin to rise to the next barrier at $0.8335 in the following few days.
In addition to the positive trend line, the 9-day EMA line was looking to cross above the 20-day EMA line. These two technical indicators crossing could signal a bullish shift in short-term momentum for MATIC.
The bullish thesis may be invalidated, however, if MATIC closes today’s daily candle below the 9-day EMA line, which was situated at $0.7682 at press time. In this bearish scenario, MATIC could be at risk of falling to as low as $0.7190.
Disclaimer: The information presented in this article is for informational and educational purposes only. The article does not constitute financial advice or advice of any kind. Coin Edition is not responsible for any losses incurred as a result of the utilization of content, products, or services mentioned. Readers are advised to exercise caution before taking any action related to the company.


