


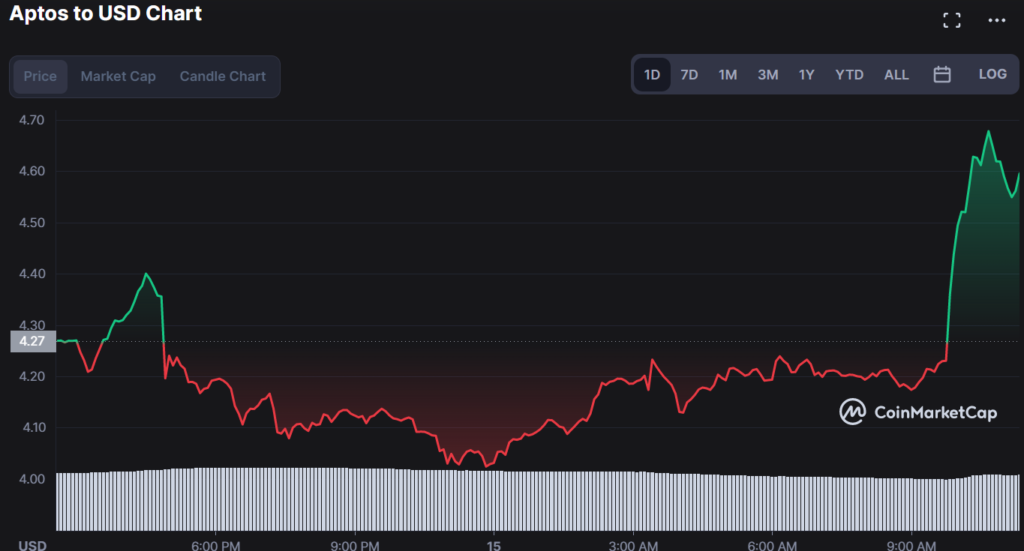
- Aptos fell to lows of $4.03 but has started recovering and is now trading above the resistance level at $4.45.
- Aptos has been performing well since its launch, managing to rank among top 100 coins.
- The current support levels are at $4.18, if it is broken, the next support will be at $3.85.
Aptos price action in the last 24 hours indicates APT token opened the daily trading session at $4.27 and moved to an intraday high of $4.776. The key support level at $4.45 has been defended, a point which is likely to see the token recover and resume its bullish run.
A swing high has been formed at $4.776 with a breakout below the $1.5 level and breached support indicated by the descending triangle pattern seen on the 1-hour chart.
However, APT may still have room to recover as it could be forming a bullish corrective pattern above the $4.45 level with growing upside momentum and increasing volumes being evidence that the asset is attracting a growing investor base and interest.
Therefore, if the price stays above the $4.45 level, it could present an opportunity for traders to buy into the bull trend with a target of $5.17 which is likely to act as resistance and a break above this level would attract more buyers aiming at $6.31.
On the flip side, if the price falls below the $4.45 level, it could signal a reversal of gains and an end of the APT bullish streak that has been in place for more than a month now.
The technical indicator on the 4-hour and hourly chart is also signaling the token is on a recovery path, with MACD lines approaching positive territory and RSI moving towards the 50 levels which could indicate an increase in buying pressure.
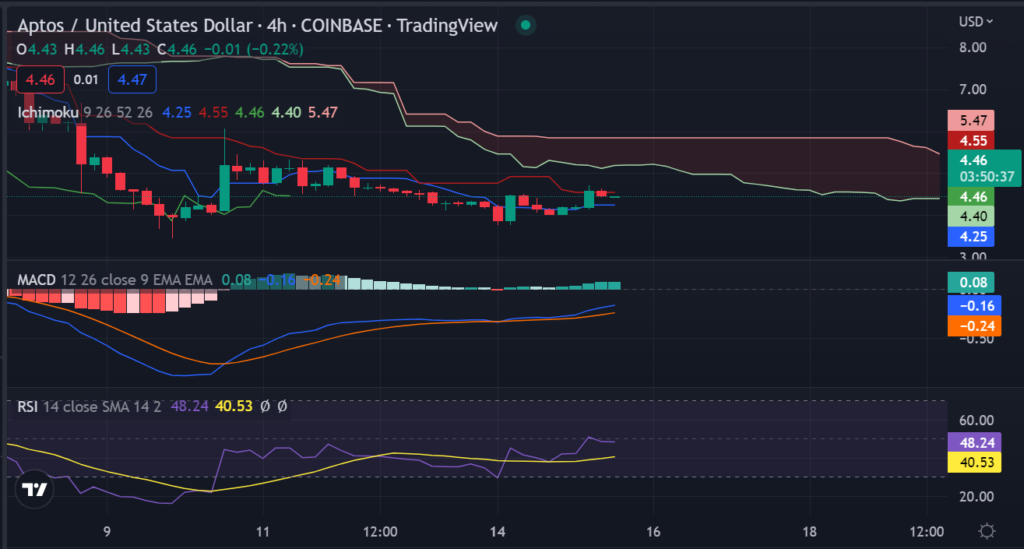
However the Ichimoku cloud on the 1-hour chart shows a bearish trend and might prevent the price from breaching $5.17 in the short term, but a bullish crossover could signal an uptrend to above this level. There are bearish candlesticks patterns present in the chart that could also indicate a reversal is underway if the price declines below $4.45.
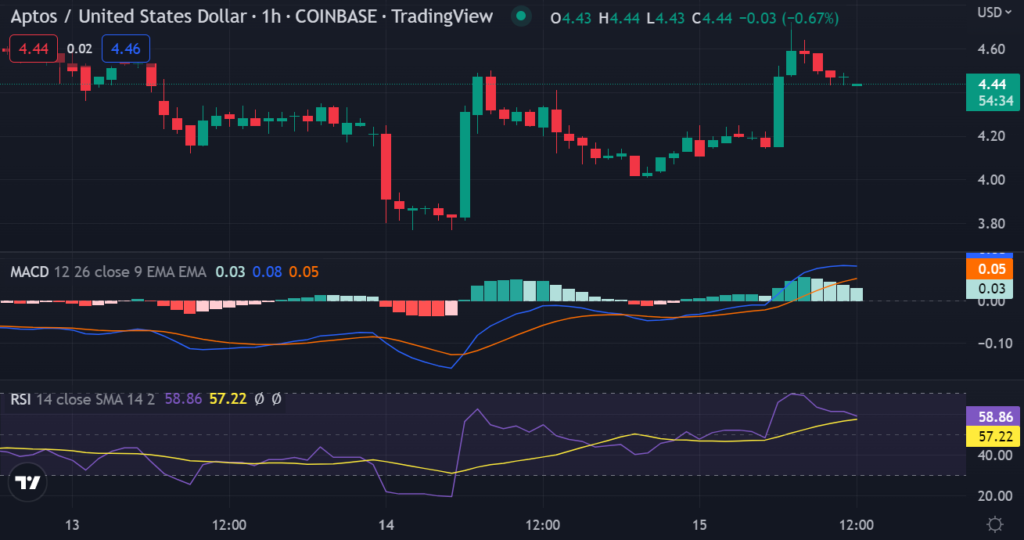
Bulls will be encouraged by the bullish crossover on the MACD and RSI as well as increasing volume which is also an indicator of a change in investor sentiment.
Aptos is trading at $4.47, with a trading volume of $179,298,860.90 and a market cap of $578,364,203.08. Aptos is trading above the major moving averages and is likely to recover further as investors buy-in on the current dip.
The 200-day moving average is also close to the key support level at $4.45, which could act as a strong bullish signal for APT price action. Overall, traders should continue to watch closely for signs of a breakout or reversal as this could provide opportunities for both long and short trades shortly.
Disclaimer: The views and opinions, as well as all the information shared in this price prediction, are published in good faith. Readers must do their research and due diligence. Any action taken by the reader is strictly at their own risk. Coin Edition and its affiliates will not be held liable for any direct or indirect damage or loss.
Disclaimer: The information presented in this article is for informational and educational purposes only. The article does not constitute financial advice or advice of any kind. Coin Edition is not responsible for any losses incurred as a result of the utilization of content, products, or services mentioned. Readers are advised to exercise caution before taking any action related to the company.
 Price Prediction 2026, 2027, 2028, 2029, 2030 -2050")


