


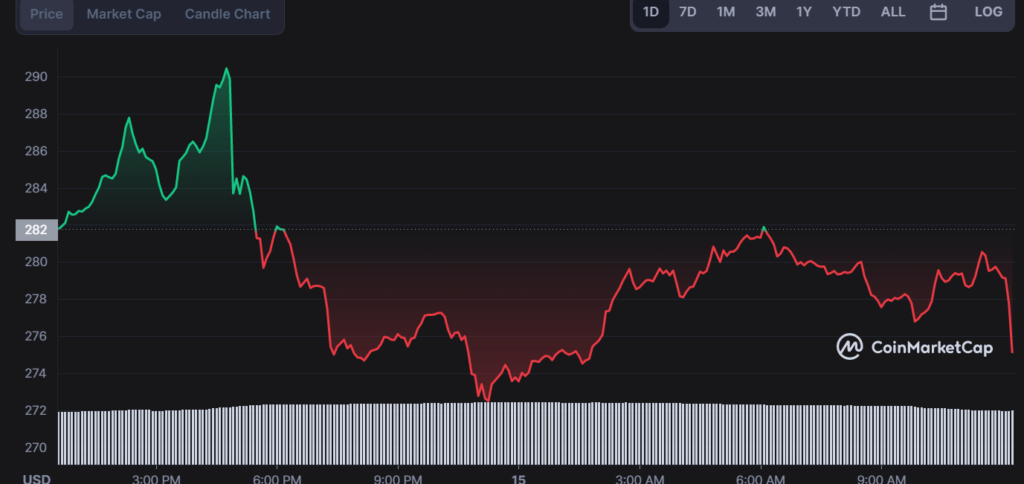
- Binance coin has been trading at a range of $272.50 to $290.72 in the last 24 hours.
- BNB coin is facing firm resistance at $285.0 and has settled at $279.43
- Binance coin market sentiment remains neutral after its price failed to break out of its bearish pennant decisively.
Binance coin price analysis shows BNB coin is still stumbling to break above $280.0 and the 50-period MA. A bullish reversal will likely happen if the BNB coin can clear $285.0 and break above its bearish pennant on the 50-period MA. The Binance coin market has not seen major price movements in the last 24 hours, trading mainly from $272.50 to $290.72.
The Binance coin price has been struggling to break out of its bearish pennant formation on the 50-period MA, indicating that the market may be set up for a bullish reversal. However, it is facing strong resistance at $285.0, which has prevented it from making any significant price moves in the past couple of days.
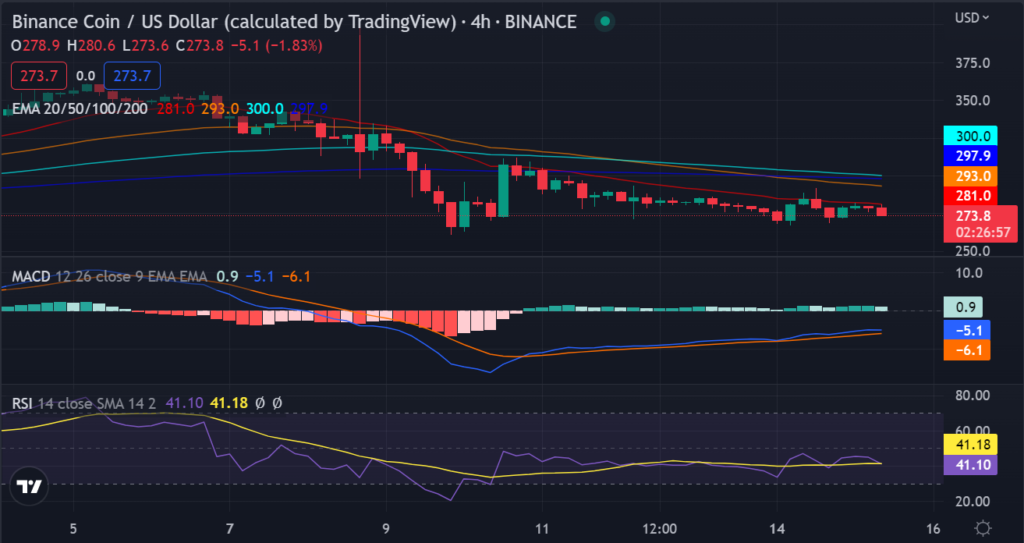
The Stochastic RSI recently crossed below the 50-period MA, signalling that the BNB coin is likely headed for a correction before making any bullish movements. Despite this technical indicator, analysts believe Binance coin may have enough momentum to break above $285.0 and trigger a bullish reversal. If it can clear $285.0, we might see further upward price movements in the coming days.
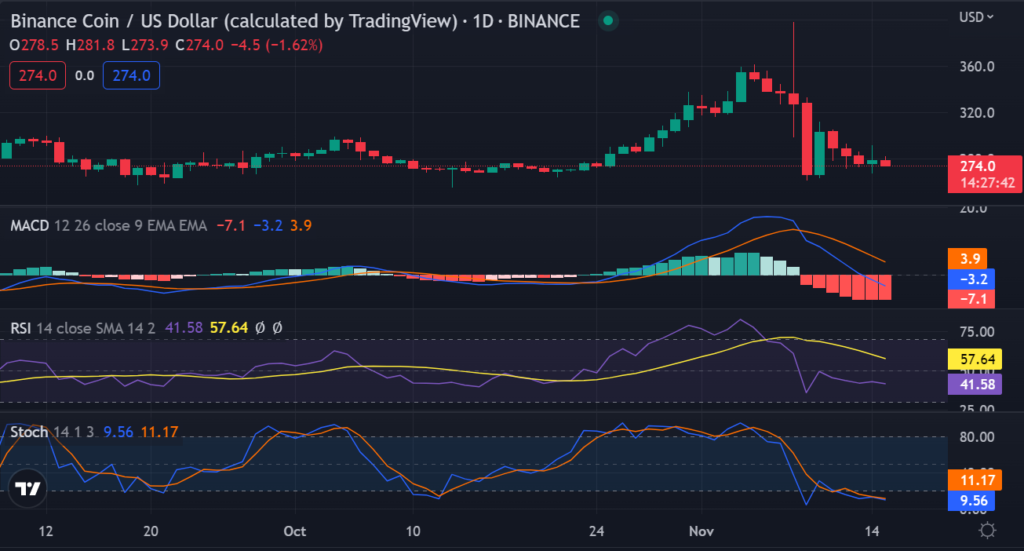
The bears have been adamant in their attempts to drive the BNB coin price down, and it remains to be seen if a bullish reversal will occur soon. However, we can track market sentiment by looking at indicators such as RSI, which currently sits at 43.75, indicating that the market is slightly oversold.
The SMA lines have crossed over, signalling that a change in market momentum could take place soon. If Binance coin can break out of its bearish pennant formation and clear $285.0, it may be on track for a bullish reversal. Moreover, the Fibonacci retracement levels show that the BNB coin could see increased support at $280.0 and a likely jump to $300.0 if it can continue rallying from this level.
Binance Coin technical indicators show that the market is set up for a bullish reversal, but it remains to be seen whether the bears can drive BNB coin down further. Despite strong resistance at $285.0 and bearish pressure, we may see increased buying interest if Binance coin can break above its 50-period MA and gain momentum. For instance, the Exponential Moving Average has flattened out, signalling that the market may be ready for a bullish reversal shortly.
The Moving Average Divergence Convergence indicator is currently above the Red signal line, which could indicate increased buying interest. The mixed signals from the technical indicators make it difficult to predict if the Binance coin will rally shortly. Still, we may see increased activity if it can break out of its bearish pennant formation and clear $285.0.
The support levels are set at $276.0 and $275.0, which the BNB coin is facing resistance at in the short term. Overall, we see increased buying activity if the Binance coin breaks its bearish pennant formation and clears $285.0 on the 50-period Moving average.
Disclaimer: The information presented in this article is for informational and educational purposes only. The article does not constitute financial advice or advice of any kind. Coin Edition is not responsible for any losses incurred as a result of the utilization of content, products, or services mentioned. Readers are advised to exercise caution before taking any action related to the company.
 Price Prediction 2026, 2027, 2028, 2029, 2030 -2050")


