


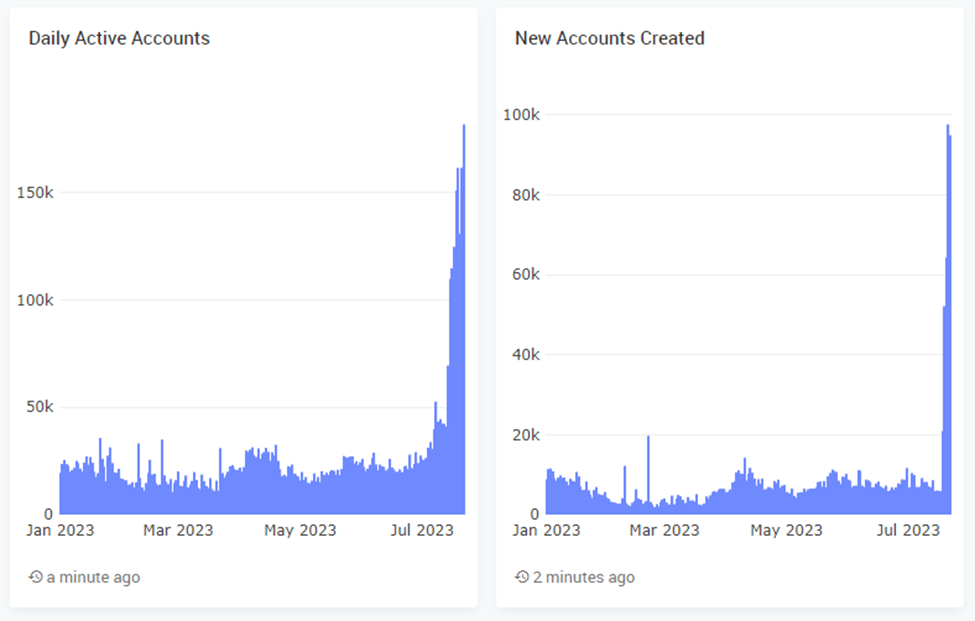
- The number of active APT addresses reached 182,000 yesterday.
- On-chain data shows that 94,000 new accounts were created in just the past 48 hours.
- A technical pattern on APT’s daily chart suggested that a price breakout may be on the horizon.
On-chain data shows that the number of active Aptos (APT) accounts reached 182,000 yesterday, which is also the highest number of addresses since the APT airdrop. Furthermore, the number of new accounts over the past 2 days exceeded 94,000. This surge in new APT holders may be linked to the integration of Chingari – a popular social media app in India.
Meanwhile, CoinMarketCap indicated that the altcoin’s price rose 0.74% over the past 24 hours. As a result, APT was changing hands at $7.68 at press time. The cryptocurrency also strengthened against the market leaders Bitcoin (BTC) and Ethereum (ETH) by 0.48% and 1.67% respectively. This meant that 1 APT was worth 0.0002567 BTC and 0.004097 ETH.
A symmetrical triangle on APT’s daily chart suggested that the altcoin’s price may experience a breakout in the coming few days. Should APT’s price enter into a bullish move in the next 24-48 hours then it may flip the resistance at $7.8252 into support. This will most likely also clear a path for APT to rise to $8.8897 in the following week.
Conversely, a breakout to the downside may result in APT’s price falling to the next crucial support level at $7.3104. Continued sell pressure may even drag the cryptocurrency down to $6.8361.
Technical indicators favored the bullish thesis at press time, however, as the 20-day EMA line was attempting to cross above the 50-day EMA line. Should these two EMA lines cross, it will signal that bulls have the upper hand and APT’s price could continue to rise in the following week.
A potential confirmation of the bullish thesis will be if APT closes today’s daily candle above the 50-day EMA line at $7.5989. Meanwhile, a close below this technical indicator could be taken as a sign that APT’s price may break out towards the downside.
Disclaimer: The views and opinions, as well as all the information shared in this price analysis, are published in good faith. Readers must do their own research and due diligence. Any action taken by the reader is strictly at their own risk. Coin Edition and its affiliates will not be held liable for any direct or indirect damage or loss.
Disclaimer: The information presented in this article is for informational and educational purposes only. The article does not constitute financial advice or advice of any kind. Coin Edition is not responsible for any losses incurred as a result of the utilization of content, products, or services mentioned. Readers are advised to exercise caution before taking any action related to the company.


