
- XRP broke below $1 on August 12 for the first time since November 2024, with the Bollinger Band lower boundary at $1.0025 as the last technical floor
- The Coreum-XRP bridge was drained of 200,000 XRP on August 9 through a relayer logic flaw, with the bridge now halted
- Large XRP wallets holding over 1M XRP grew by 32 in three months despite a 29% market cap decline, per Santiment
The XRP price prediction points to $1.0537 on the bullish side and $0.95 on the bearish side, with XRP breaking below $1 for the first time since November 2024 after touching a low of $0.99.
XRP Price Analysis: $1 Breaks as the Bollinger Band Becomes the Last Floor
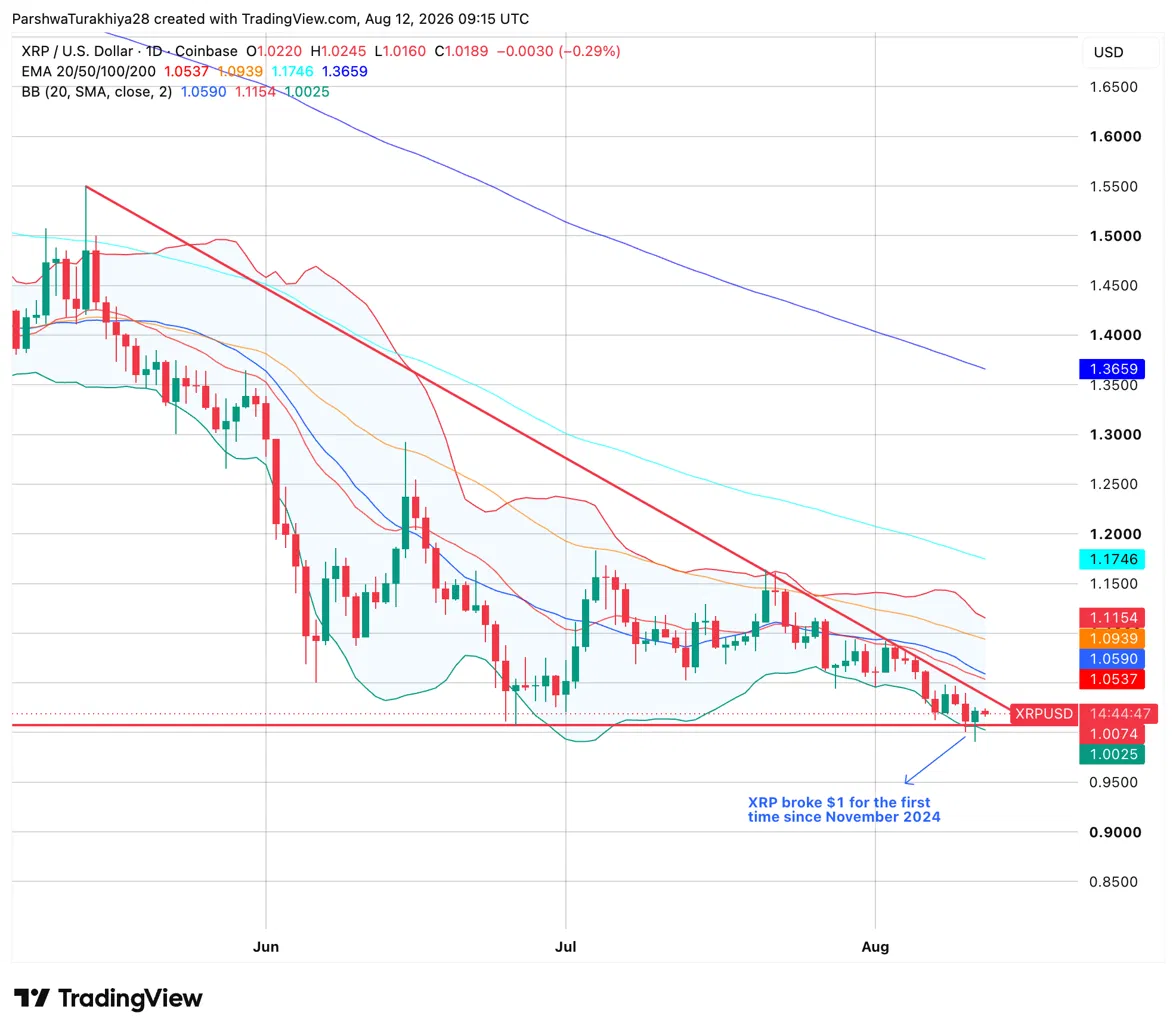
XRP broke the $1 psychological floor that had held since November 2024, with today’s session printing a low of $1.016 before recovering to $1.0189. The Bollinger Band lower boundary at $1.0025 is now the only technical support remaining below the round number.
All four EMAs slope downward above price in a stacked bearish configuration: the 20-day at $1.0537, 50-day at $1.0939, 100-day at $1.1746, and 200-day at $1.3659. The Bollinger Band midline at $1.0590 aligns closely with the 20-day EMA, making that zone the first resistance cluster any recovery needs to clear.
The break matters beyond the chart. It’s a psychological reset for holders who bought during the 2024 and 2025 cycles, and historically, breaks of major round numbers in declining assets either accelerate the decline or trigger sharp reversals as capitulation buyers step in.
XRP Support and Resistance Levels, August 12, 2026
| Type | Price | Level |
| Resistance | $1.0537 | 20-day EMA and Bollinger midline |
| Resistance | $1.0939 | 50-day EMA |
| Resistance | $1.1154 | Bollinger Band upper boundary |
| Resistance | $1.1746 | 100-day EMA |
| Support | $1.0025 | Bollinger Band lower boundary, last floor |
| Support | $1.00 | Round number, broken intraday |
XRP News: Coreum Bridge Drained of 200K XRP — What Actually Happened?
The Coreum-XRP bridge was drained of approximately 200,000 XRP on August 9 through a logic flaw in the bridge’s relayer code, a set of programs that verify and approve cross-chain deposits, not through the DefaultRipple account flag that initial warnings blamed.
How the Exploit Actually Worked
The attacker exploited a gap in how relayers verify deposits. They sent the bridge’s own wrapped token between two wallets they controlled, attaching a bridge deposit memo to the transaction. Because the bridge issues that token, the transfer showed up in its transaction history.
The relayer code checks for payments in the bridge’s history but never verifies the destination was actually the bridge itself. It read each self-payment as a legitimate deposit and attested to it. Once enough relayers attested, the contract minted the attacker a matching balance, and the entire 200,000 XRP drained was simply the legitimate withdrawal of that fabricated balance.
Why the Initial DefaultRipple Warning Was Wrong
The widely shared initial warning attributed the drain to the DefaultRipple flag and partial payment loops. On-chain analysis showed neither was true: native XRP cannot ripple through trust lines by design, and none of the 94 payments used the partial payment flag. The bridge signed every payment itself through a 17-of-28 multisig quorum, meaning the flaw lived in the relayer logic on the Coreum side, not the XRP Ledger.
The bridge has since been halted. Roughly 4 million wrapped tokens remain unsold in the attacker’s wallets, and the drained XRP was forwarded through fresh wallets to older staging accounts in what analysts describe as a standard laundering pattern.
XRP Analysis: Large Holders Keep Buying Despite the Price Drop
Santiment flagged on August 11 that the number of wallets holding over 1 million XRP has grown by 32 in three months, even as XRP’s market cap fell 29% over the same period. That points to a specific market dynamic: stronger, more patient hands absorbing supply as smaller holders exit during the decline.
RLUSD has also grown into a meaningful institutional stablecoin over the same stretch, and Ripple’s payments, custody, and tokenization rails continue tying the XRP Ledger to real settlement use cases even as price underperforms.
Related: TRON Price Prediction: Can $2.1T USDT Activity Lift TRX?
When large holder counts rise during a sustained price decline, it historically signals the asset is moving from weak hands to strong ones, a transition that tends to precede rather than follow meaningful recoveries.
XRP ETF Flows: Zero Inflows as Weekly Magnitude Keeps Shrinking
XRP spot ETFs recorded zero net inflow for the week of August 11 through the first two sessions, continuing a trend of shrinking weekly flow that has been visible since May. Weekly inflows peaked at $60.50M in mid-May, then compressed through $22.04M, $15.20M, $14.86M, $8.15M, and $1.01M in successive weeks before this week’s flat start. Cumulative net inflows hold at $1.51B with total net assets at $943.11M, just below the $1B mark.
Three sessions remain in the current week, but the trajectory of declining weekly flow combined with the $1 break suggests institutional appetite for XRP via ETFs is cooling at the same moment the price is under its most significant pressure of the year.
| Week | Weekly Net Inflow |
| May 15, 2026 | $60.50M |
| Jul 31, 2026 | $14.86M |
| Aug 7, 2026 | $1.01M |
| Aug 11, 2026 (partial) | $0 |
XRP Price Prediction: Upside and Downside Targets
Bullish Case, Target: $1.0537 (20-day EMA)
The $1 break proves to be a capitulation wick rather than a sustained breakdown, and XRP closes back above $1.0025 on a daily basis. Large holder accumulation documented by Santiment absorbs the available sell pressure, and the Coreum bridge exploit proves to be a contained third-party incident with no impact on XRP’s core infrastructure. Price recovers toward the Bollinger midline and 20-day EMA at $1.0537 as the first meaningful recovery target.
Bearish Case, Risk Level: $0.95 (Below Round Number)
The Bollinger Band lower boundary at $1.0025 fails to hold on a daily close and XRP establishes itself below $1 for the first time since November 2024. ETF weekly flows recording zero for a second consecutive week signals institutional demand has fully dried up, and the bridge exploit weighs on broader sentiment around XRP’s ecosystem safety. Price extends toward $0.95 as the next area without clear technical support.
Related: Cardano Price Prediction: ADA Retreats From $0.20 as Analyst Warns of a Slide to $0.170
Conclusion
XRP’s break below $1 is the result of three separate pressures landing at once rather than a single clean catalyst, which makes the setup harder to read than a typical technical breakdown. The bridge exploit and fading ETF flows are the visible bearish forces, but large holder accumulation running in the opposite direction is a genuine counterweight, not just noise.
The Bollinger Band lower boundary at $1.0025 is the level that decides which force wins first: hold it and $1.0537 becomes the next real test, lose it and $0.95 opens up with no clear technical floor in between.
FAQs Related to XRP Price Prediction
XRP trades at $1.0189 after breaking below $1 for the first time since November 2024. The bullish target is $1.0537 (20-day EMA); the bearish risk level is $0.95 if the Bollinger Band lower boundary fails.
Three pressures converged: a Coreum bridge exploit that drained roughly 200,000 XRP, a second straight week of zero ETF inflows, and broader market weakness. Together they pushed XRP through a psychological level it had held since 2024.
An attacker sent the bridge’s own wrapped token between two of their own wallets with a fake deposit memo. The relayer code mistook the self-payment for a real deposit and credited a fabricated balance, which the attacker then withdrew as real XRP.
Wallets holding over 1 million XRP grew by 32 in three months even as market cap fell 29%, according to Santiment. That pattern, strong hands buying while smaller holders exit, has historically preceded rather than followed price recoveries.
It marks the second straight week of shrinking demand, following a steady decline from $60.50M in weekly inflows in mid-May. Combined with the break below $1, it signals institutional appetite is cooling at a particularly weak moment for price.
XRP has genuine accumulation from large holders working in its favor, but the Coreum exploit and fading ETF demand add real near-term uncertainty. Weigh the bullish and bearish cases above against your own risk tolerance.
Disclaimer: The information presented in this article is for informational and educational purposes only. The article does not constitute financial advice or advice of any kind. Coin Edition is not responsible for any losses incurred as a result of the utilization of content, products, or services mentioned. Readers are advised to exercise caution before taking any action related to the company.