


- According to recent data, the YFI market has been dominated by bears in the previous 24 hours.
- YFI market finds support around $6,165.14 during the downturn.
- Bulls must pull up their socks to reverse the trend.
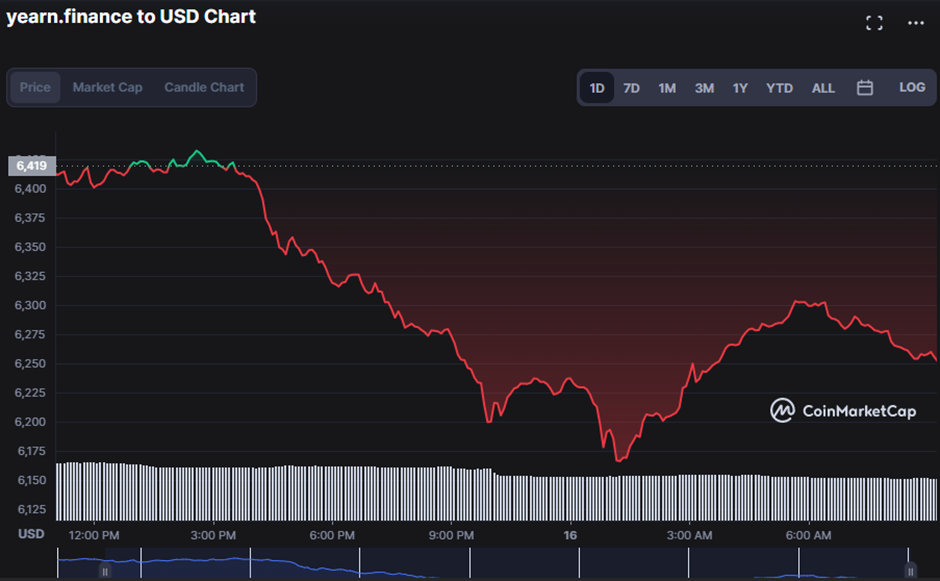
According to CoinMarketCap, the yearn.finance (YFI) market has been influenced by selling pressure in the previous 24 hours. At the dawn of the market, bulls attempted to seize dominance of the market, but their enthusiasm was quickly dashed as the price of YFI encountered resistance at $6,431.98.
The bears managed to value the YFI price at $6,281.26 as of press time, a 2.13% slide.
The withdrawal of investors reflects this bear domination, prompting market capitalization and 24-hour trading volume to tumble by 2.38% to $229,606,044 and 28.68% to $13,685,123, respectively.
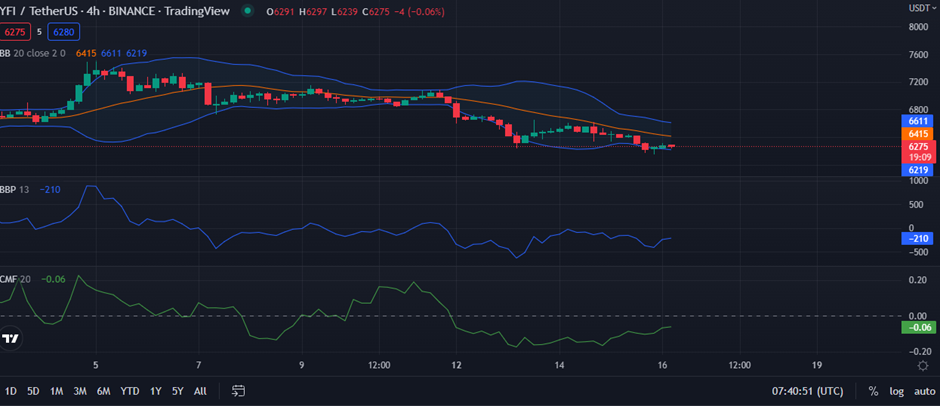
On a 4-hour price chart, narrowing Bollinger Bands pointing south indicate a reduction in market volatility. Being a negative sign, this suggests the YFI market will remain under the control of bears. Readings of 6611 and 6219 on the top and lower bands, respectively, support this idea. The market price’s recent movement towards the lower band only serves to reinforce this gloomy outlook.
The current market is being driven by bears, as shown by the Bull Bear Power (BBP) indicator’s negative rating of -208. The fact that it is trending higher, though, provides investors optimism for a turnaround if bulls continue their drive.
The Chaikin Money Flow (CMF) indicator warns traders of a further bear run. A positive reading on the CMF denotes a bullish trend; however, because the CMF on the YFI price chart is -0.06, current bear dominance is expected to endure.
On the price chart, a bearish engulfing candlestick is forming, adding to the bearish mood in the YFI market. The bearish crossover, shown by the movement of the short-term MA below the long-term MA, goes hand in hand with this negative domain. The long-term MA and short-term MA show this perception with values of 6791 and 6716, respectively.
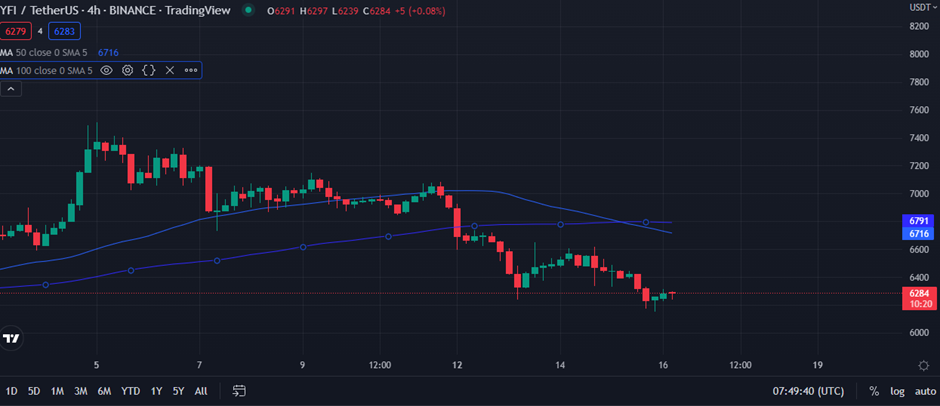
In conclusion, the technical indications show that if bulls don’t regain control of YFI soon, the present negative trend may continue.
Disclaimer: The views and opinions, as well as all the information shared in this price analysis, are published in good faith. Readers must do their own research and due diligence. Any action taken by the reader is strictly at their own risk, Coin Edition and its affiliates will not be held liable for any direct or indirect damage or loss
Disclaimer: The information presented in this article is for informational and educational purposes only. The article does not constitute financial advice or advice of any kind. Coin Edition is not responsible for any losses incurred as a result of the utilization of content, products, or services mentioned. Readers are advised to exercise caution before taking any action related to the company.
 Price Prediction 2026, 2027, 2028, 2029, 2030-2050")
 Price Prediction 2026, 2027, 2028, 2029, 2030-2050")


