
- ATOM has been on a roller coaster ride, almost reaching the opening market price.
- Three higher highs were reached in the course of four days.
- Cosmos is currently fluctuating in a bearish rising wedge. The bulls may come to its rescue.
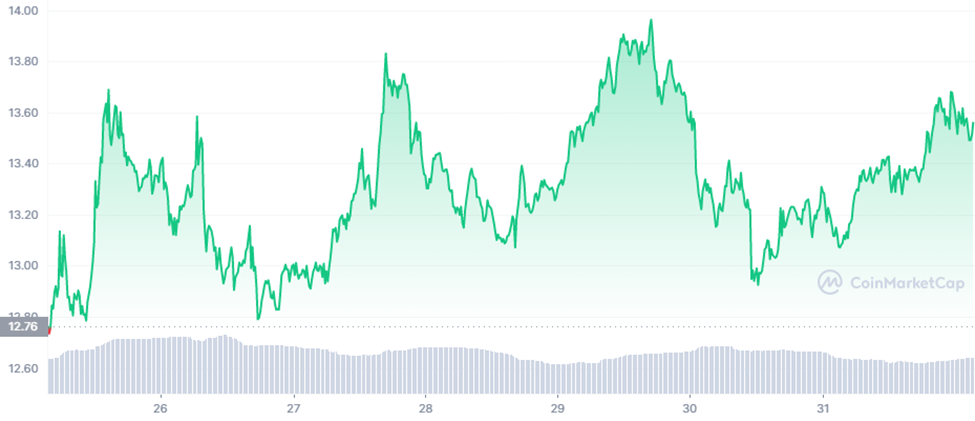
Cosmos (ATOM) has been on a roller coaster ride during the past week. Trading at an opening market price of $12.76, ATOM reached $13.67 within a few hours. However, it did not surge straight from its opening market price. The token went through a rugged path of ups and downs before its aforementioned level ($13.67).
Thereafter, ATOM started descending again. Although the bulls were able to slow down the rate of ATOM’s downward movement, the bears were heavy-handed. Hence, ATOM reached the support level close to its opening market price on the first day.
On the second day of the week, the token started rising exponentially, reaching its peak of $13.83 (Second Crest on the chart); thereafter, it started descending. However, this time ATOM was able to recover at $13.01 (Second Trough), much higher than the opening market price.
From there, the token went on to register its highest price of $13.96 on the fourth day of the week. At other times, ATOM started declining after reaching the top. The token made a higher low at $12.92 on the fifth day. Currently, ATOM is on the rise, up 3.36% in the last 24 hours, and as of press time, it is $13.51.
As shown in the chart below, ATOM has been fluctuating in a bearish rising wedge recently. More importantly, ATOM has been following the Bollinger bands very closely. The market corrected the price at every instance when the token either reached the upper or lower Bollinger band. As of present, the market corrected ATOM’s price after it touched the lower Bollinger band.
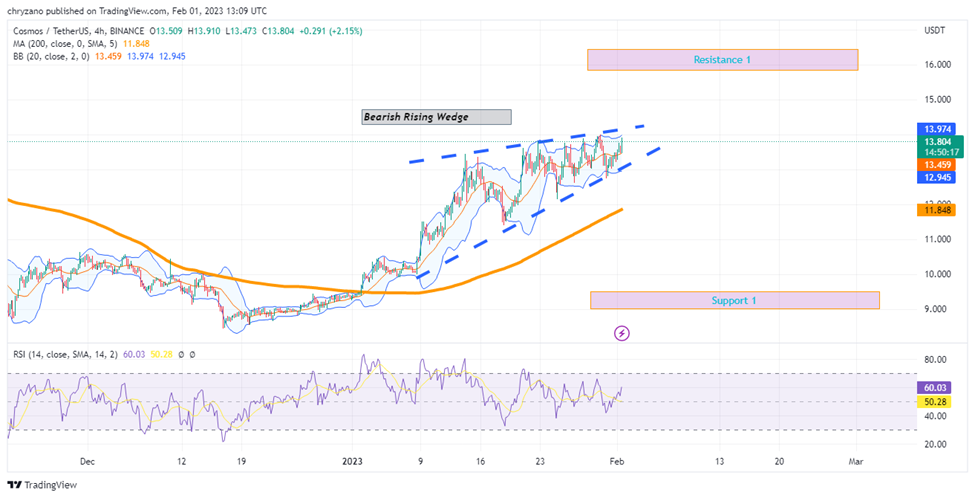
ATOM is now reaching the upper Bollinger band. Will the market again correct the ATOM if it hits the upper Bollinger band? Or will the bulls be strong enough to break above the upper Bollinger band?
Contrastingly, if the bears take over the market, ATOM could tank to support 1. However, the 200-day MA seems to be interjecting. However, it is questionable whether the 200-day MA can sustain ATOM before tanking to support 1.
Disclaimer: The views and opinions, as well as all the information shared in this price analysis, are published in good faith. Readers must do their own research and due diligence. Any action taken by the reader is strictly at their own risk, Coin Edition and its affiliates will not be held liable for any direct or indirect damage or loss.
Disclaimer: The information presented in this article is for informational and educational purposes only. The article does not constitute financial advice or advice of any kind. Coin Edition is not responsible for any losses incurred as a result of the utilization of content, products, or services mentioned. Readers are advised to exercise caution before taking any action related to the company.


 Price Prediction: UNI Eyes $5 as UNI Extends Bullish Breakout")
