

- AVAX swept the $11.796 September high before rejecting near the $12 price area.
- The $10.754-$10.60 Fibonacci zone is the first support after the liquidity sweep.
- A sustained break below $10.60 would put the $10.169 retest level back in focus.
The rejection above September’s $11.796 high puts $10.754–$10.60 in focus, with $10.169 next if support fails.
| CHART PRICE | SEPTEMBER HIGH | FIRST SUPPORT | DOWNSIDE REFERENCE |
| $10.986 | $11.796 | $10.754–$10.60 | $10.169 |
September High Sweep Refocuses AVAX on Support
Avalanche entered October after September’s advance shifted its four-hour structure higher. The chart shows AVAX breaking above $8.197 before expanding toward $10. The token’s price then returned to $10.169 for a marked retest before buyers resumed the advance.
That renewed buying pressure pushed AVAX through the $11.796 September high. However, the breakout failed after a wick extended toward $12, and AVAX’s price quickly retreated. As a result, the move swept liquidity above the September high before returning beneath it, shifting attention from further expansion toward nearby support.
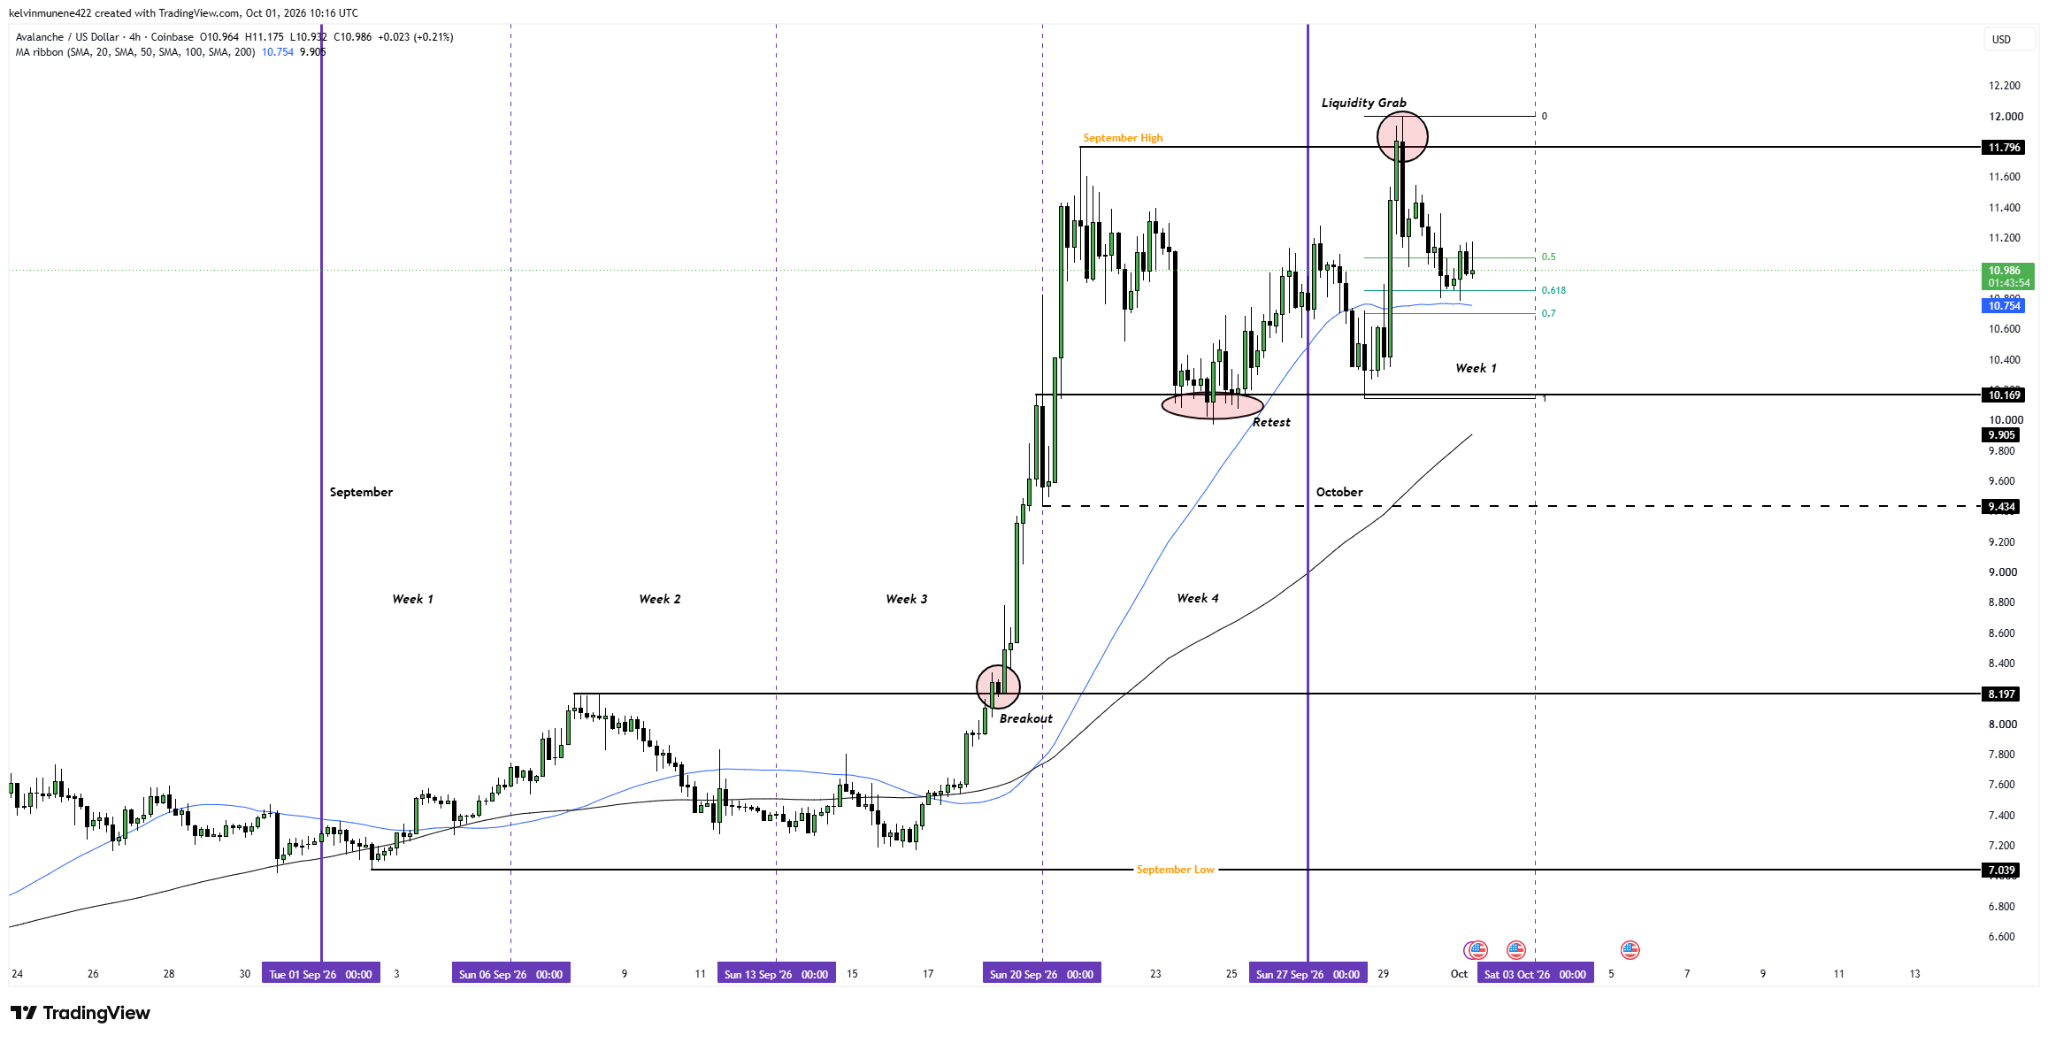
The first support test now sits at 10.754–10.60. This area contains the 0.618-to-0.7 Fibonacci retracement zone and the 50-period moving average near $10.754. With AVAX near $10.986 on the supplied chart, price remained above that support cluster as October began.
$10.169 Becomes the Main Downside Reference
Holding $10.754–$10.60 would preserve the higher September structure and keep $11.796 as the main upside reclaim level. However, a sustained move below $10.60 would expose $10.169, the area retested before the advance toward $12.
From $10.986, a decline to $10.169 equals roughly 7.4%. Below that level, the chart identifies $9.434 as the next marked support. Conversely, a sustained reclaim above $11.796 would weaken the retracement structure and return the $12 area to focus.
LEVELS THAT DECIDE THE NEXT AVAX MOVE
| LEVEL | ROLE IN THE CURRENT SETUP |
| $11.796 | September high and key reclaim level |
| $10.754–$10.60 | 0.618–0.7 Fibonacci support zone |
| $10.169 | Previous retest and primary downside reference |
| $9.434 | Next marked support if $10.169 fails |
RECOVERY CASE
Holding $10.754–$10.60 preserves the higher September structure. Moreover, a sustained move above $11.796 would return the $12 region to focus.
DEEPER RETRACEMENT CASE
On the other hand, a sustained break below $10.60 exposes $10.169. Losing that support would shift attention toward the next marked level at $9.434.
BOTTOM LINE
Overall, the rejection above $11.796 places $10.754–$10.60 at the center of the October setup. A sustained break below it would bring $10.169 into focus, while a firm reclaim above $11.796 would weaken the retracement setup and return to the $12 area.
FAQs
It marks the previous retest area that held before the latest advance through September’s high.
The chart places 0.618-to-0.7 Fibonacci support around $10.754–$10.60.
A sustained reclaim above $11.796 would weaken the current pullback structure.
The next major support reference marked on the chart sits near $9.434.
A sustained reclaim above the $11.796 September high would return that area to focus.
Related: Crypto Market Price LIVE: Can BTC and ETH Extend Their Q3 Lead in Q4?
Disclaimer: The information presented in this article is for informational and educational purposes only. The article does not constitute financial advice or advice of any kind. Coin Edition is not responsible for any losses incurred as a result of the utilization of content, products, or services mentioned. Readers are advised to exercise caution before taking any action related to the company.