


- 72.3% of the gas consumed by the network was attributed to inscription activity.
- AVAX was testing a key support level and technicals suggested it may continue to drop.
- Wu Blockchain revealed that gas consumption for Avalanche’s C-Chain reached more than $20 million.
Wu Blockchain revealed in an X post earlier today that gas consumption for Avalanche’s C-Chain soared above $20 million in the past week. According to the post, 72.3% of the consumption was due to inscription activity. This inscription activity also accounted for 86.5% of the transactions on the network during the same period.
At press time, the price of AVAX was down 7.91% according to CoinMarketCap. As a result, the cryptocurrency was changing hands at $39.01. Despite the 24-hour loss, AVAX’s price was still up more than 10% on the weekly timeframe. Furthermore, the altcoin was still ranked as the ninth biggest cryptocurrency in terms of market cap, with a valuation of $14.26 billion.
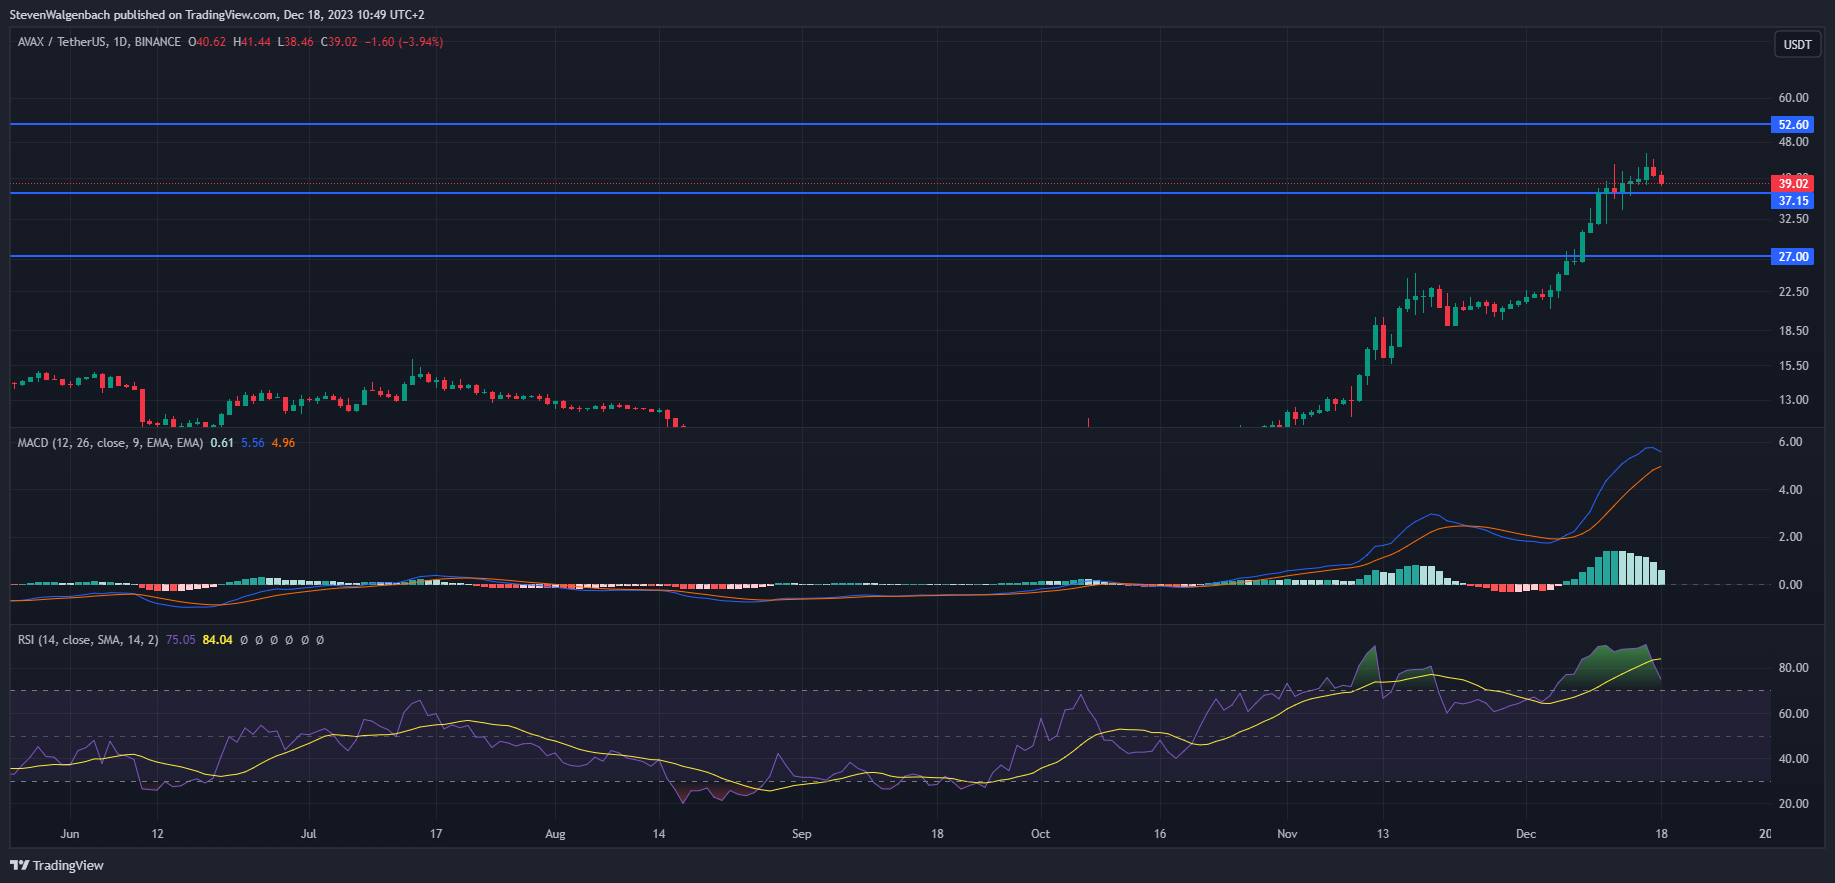
Daily chart for AVAX/USDT (Source: TradingView)
AVAX was able to break above the $37.15 resistance level over the past few days. Since breaking above this threshold, the altcoin’s price has been in a consolidation phase. However, traders now seem to be offloading their AVAX holdings, as the altcoin was approaching support.
Should AVAX close a daily candle below $37.15 in the next 48 hours, then it may fall as low as $27 in the following week. On the other hand, AVAX remaining above $37.15 could see the altcoin rise toward the $52.60 resistance level in the short term.
Technical indicators on AVAX’s daily chart suggested that AVAX’s price may drop in the next few days. Both the Moving Average Convergence Divergence (MACD) and the Relative Strength Index (RSI) indicators were flagging bearish at press time.
The MACD line was closing in on the MACD signal line, which could lead to a bearish trend reversal for AVAX if the two lines intersect. In addition to this, the RSI line broke below the RSI Simple Moving Average (SMA) line in the past few days. This is indicative of sellers gaining the upper hand against bulls.
Disclaimer: The information presented in this article is for informational and educational purposes only. The article does not constitute financial advice or advice of any kind. Coin Edition is not responsible for any losses incurred as a result of the utilization of content, products, or services mentioned. Readers are advised to exercise caution before taking any action related to the company.


 Price Prediction 2026, 2027, 2028, 2029, 2030-2050")

