


- Basic Attention token price analysis shows a firm uptrend.
- An ascending trendline has been formed on the 4-hour chart.
- BAT/USD pair is facing resistance at the $0.3368.
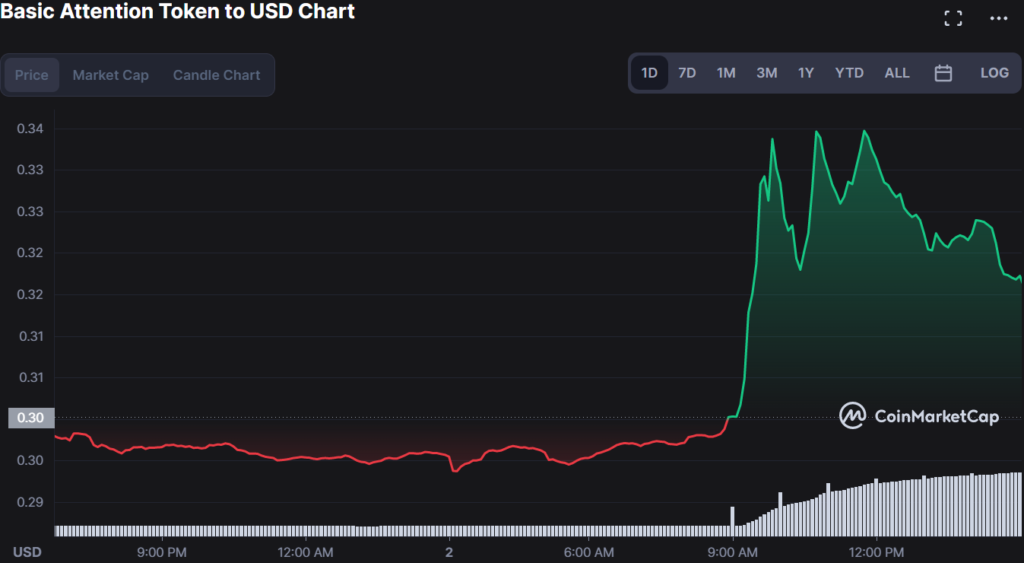
The Basic Attention Token (BAT) has seen significant price growth over the past 24 hours, rising by 6.28% and setting a new high of $0.3172. This comes after a breakout from a symmetrical triangle pattern, indicating a clear uptrend for the token. The BAT token opened the daily trading session at an intra-day low of $0.2982, steadily climbing throughout the day to reach its current price of $0.3169 at press time.
Looking at the 4-hour chart, an ascending trendline can be seen formed from the token’s low on October 28th to its intra-day high on 31st October. This uptrend is also reflected in its moving averages, with the 20-day and 50-day currently trading above the token’s current price.
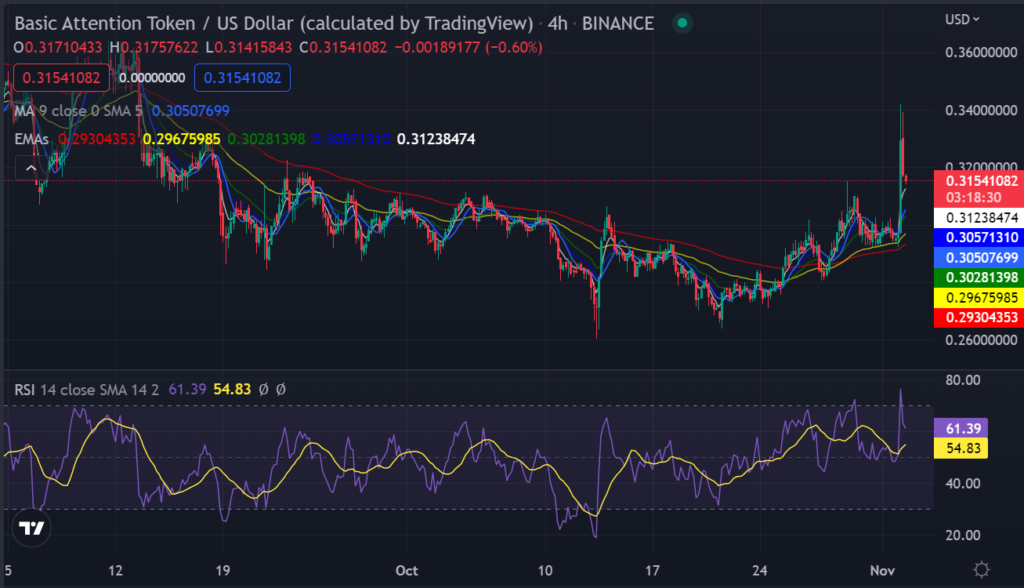
However, the BAT/USD pair is facing resistance at the $0.3368 level, which could potentially act as a roadblock for further price growth. In order to break above this level, the token will need to gather enough buying momentum.
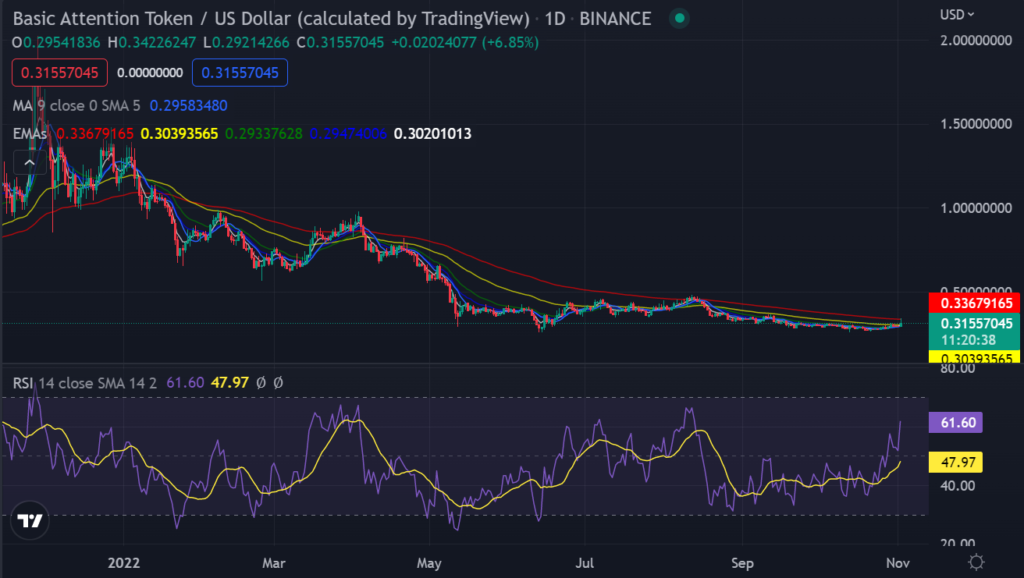
Despite this, the token’s RSI is currently in overbought territory, indicating that it may face a corrective pullback in the near future. The breakout also saw BAT move above its 200-day moving average, indicating that it may continue its uptrend in the long term. Technical indicators such as the Relative Strength Index (RSI) and Moving Average Convergence Divergence (MACD) are also showing strength in the buying pressure.
The SMA lines on the daily chart also show a bullish crossover, indicating that the long-term trend for BAT may be headed upwards. Morever, the EMA lines on the weekly chart show a similar crossover, hinting at potential growth for the token in the long term.
Overall, BAT’s recent price movements and technical indicators suggest that it may continue its uptrend in the near future, potentially breaking above its resistance level of $0.3368. However, on the downside, BAT’s failure to break above the level and a potential corrective pullback may see it retest support at the $0.2900 level.
Disclaimer: The views and opinions, as well as all the information shared in this price prediction, are published in good faith. Readers must do their research and due diligence. Any action taken by the reader is strictly at their own risk. Coin Edition and its affiliates will not be held liable for any direct or indirect damage or loss.
Disclaimer: The information presented in this article is for informational and educational purposes only. The article does not constitute financial advice or advice of any kind. Coin Edition is not responsible for any losses incurred as a result of the utilization of content, products, or services mentioned. Readers are advised to exercise caution before taking any action related to the company.
 Price Prediction 2026, 2027, 2028, 2029, 2030-2050")
 Price Prediction 2026, 2027, 2028, 2029, 2030-2050")


