


 Price Prediction 2024-2030: Will BEAM Price Hit $0.1 Soon?")
- The projected price range for BEAM in 2024 is $0.01482 to $0.02916.
- BEAM’s price could exceed its current ATH of $0.04434, potentially reaching $0.070 by 2028.
- By 2040, Beam may reach a high of $1.50, supported by widespread blockchain adoption.
Beam (BEAM) has carved out a unique niche in the cryptocurrency world as a highly acclaimed privacy blockchain. Since its launch in 2019, it has attracted a growing number of users due to its secure and cost-effective transactions.
Renowned for its Avalanche capabilities, BEAM stands out as a Proof-of-Authority blockchain that ensures the trustworthiness of validators. Furthermore, its compatibility with the Ethereum Virtual Machine (EVM) and the Mainnet Subnets Explorer has strengthened its position in the market.
As Beam continues to surprise experts by maintaining its market cap, many wonder if this trend will continue in the coming years. Read on to discover the potential trajectory of Beam’s price and whether it might soon hit that coveted $ mark.
Table of contents
- What is Beam (BEAM)?
- Beam (BEAM) Current Market Status
- Beam (BEAM) Price Analysis
- Beam (BEAM) Price Prediction 2024-2030 Overview
- Beam (BEAM) Price Prediction 2024
- Beam (BEAM) Price Prediction 2025
- Beam (BEAM) Price Prediction 2026
- Beam (BEAM) Price Prediction 2027
- Beam (BEAM) Price Prediction 2028
- Beam (BEAM) Price Prediction 2029
- Beam (BEAM) Price Prediction 2030
- Beam (BEAM) Price Prediction 2040
- FAQs
What is Beam (BEAM)?
Imagine a gaming universe where possibilities are limitless—this is what Beam offers. A trailblazer in blockchain technology, Beam empowers gamers and developers to craft the future of gaming with its advanced and community-driven platform.
Harnessing the Avalanche network, Beam boasts unmatched scalability, speed, and security, all underpinned by its reputation-based Proof-of-Authority (PoA) consensus. This means only the most trustworthy validators guide the network, ensuring a seamless experience for users.
Central to this ecosystem, the BEAM token fuels transactions and powers governance, enabling participants to shape Beam’s future. But that’s just the beginning.
Beam’s Ethereum Virtual Machine (EVM) compatibility invites developers to effortlessly bring their Ethereum-based creations into Beam’s vibrant world, making game development as smooth as a dream.
Beam’s ecosystem thrives with tools like Beam AMM Swap, Sphere, and BeamOS, offering everything from decentralized exchanges to a bustling marketplace for gaming NFTs.
Beam (BEAM) Current Market Status
The BEAM token has caught the attention of investors this past week, exhibiting a solid bullish trend that peaked at $0.01943. This impressive performance represents a 7.07% increase from its starting price of $0.0168. However, the token’s momentum faced a setback, as it experienced a 5.38% decline over the last 24 hours.
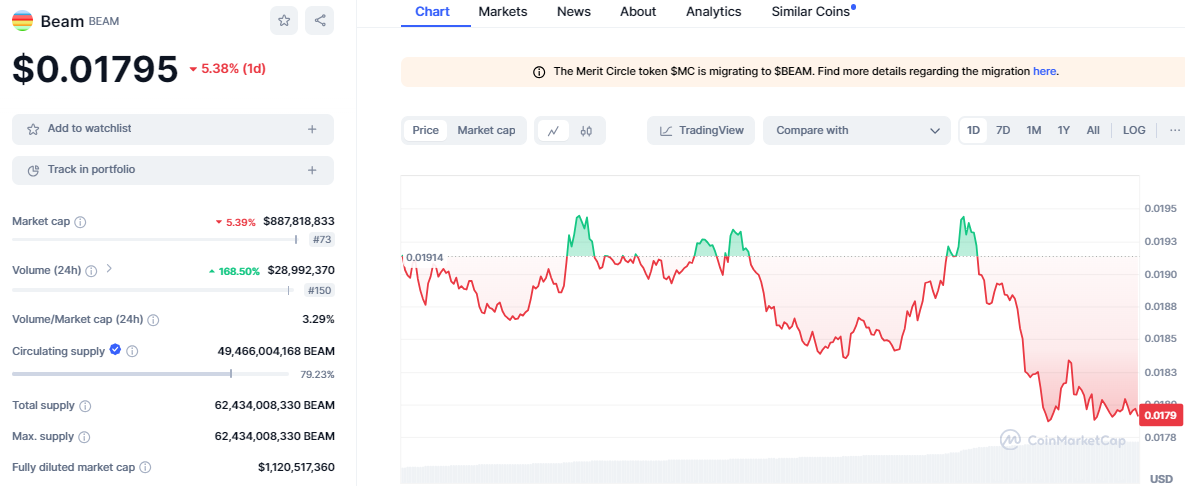
This downward shift led BEAM to intraday lows of $0.01787, but it soon began to show signs of recovery. At the time of writing, BEAM was trading at $0.01795. The recent drop caused its market cap to fall to $887 million, placing BEAM at 73rd in the cryptocurrency rankings.
The bearish turn in BEAM’s price aligns with a broader negative trend in the crypto market. Interestingly, its trading volume tells a different story, soaring by 168.50% to $28.992 million.
Despite the recent setback, market analysts remain bullish on BEAM’s long-term prospects. They point to the token’s solid fundamentals and growing community support as signs of future growth. Over the past year, BEAM has shown impressive bullish trends, with its value surging by 263.03%.
Beam (BEAM) Price Analysis
BEAM’s recent price swings have captured the attention of traders worldwide, sparking both intrigue and concern. Despite its recent hurdles, there remains an air of anticipation about a potential comeback.
Coin Edition examines BEAM’s future and the possibilities that may be on the horizon for this intriguing token.
Beam (BEAM) Price Analysis – Bollinger Bands
On the 4-hour chart, Bollinger Bands are moving sideways, signaling a period of low volatility and consolidation. Moreover, the BEAM price is currently wedged between the $0.01939 upper band and the $0.01744 lower band.
Despite this tight range, the price is lingering below the middle band, hinting at a potential short-term bullish shift. If this trend holds, BEAM might target the lower Bollinger Band, setting the stage for a dramatic test of resistance.
Beam (BEAM) Price Analysis – Relative Strength Index
Adding to this bearish outlook, the RSI indicator is trending downwards, reinforcing the selling pressure on BEAM. With an RSI of 46.02, below the neutral 50 line, there’s room for the price to drop further before it hits oversold territory.
If this momentum persists, BEAM could slip to the $0.01700 mark before we see any signs of a market reversal.
Beam (BEAM) Price Analysis – Moving Average Convergence Divergence
Meanwhile, the MACD indicator aligns with this negative sentiment, moving downward and nearing the zero line at $0.00005. This suggests increasing selling pressure that might drive the price lower soon.
The MACD histogram also shows a decrease in momentum as its bars widen in the red zone, further emphasizing the bearish trend.
Beam (BEAM) Price Prediction 2024-2030 Overview
| Price Prediction | Potential Low ($) | Potential High ($) |
| 2024 | $0.01482 | $0.02916 |
| 2025 | $0.01800 | $0.03800 |
| 2026 | $0.01600 | $0.03100 |
| 2027 | $0.03000 | $0.04400 |
| 2028 | $0.04500 | $0.07000 |
| 2029 | $0.06200 | $0.10000 |
| 2030 | $0.9500 | $0.1600 |
| 2040 | $0.8900 | $1.5000 |
Beam (BEAM) Price Prediction 2024
From a technical perspective, the Directional Movement Index (DMI) shows a weak trend, with the Average Directional Index (ADX) sitting at 13.5104. Typically, an ADX reading above 20 signifies a strong trend, so this suggests a lack of momentum in the market. Meanwhile, the Positive Directional Indicator (+DI) is at 24.1300, hinting at some upward activity but not enough to confirm a bullish stance.
In contrast, the Negative Directional Indicator (-DI) registers a notably high 18.1674, indicating significant selling pressure and a dominant bearish trend. This scenario suggests that sellers currently have the upper hand. However, the low ADX value implies that the trend’s strength isn’t overwhelming, leaving room for market indecision or the possibility of an unexpected reversal.
Given these indicators, analysts are cautious about BEAM’s next moves. If the current support level at $0.01774 fails, the price might slide down to the $0.016 support, a level observed on July 25. Should this support be breached, it could signal a robust bearish sentiment, potentially driving prices lower toward the 23.6% Fibonacci retracement level at $0.01482.
On the other hand, if the market sentiment shifts, BEAM might experience a significant rally. A breakthrough past the $0.20 resistance could set the stage for an upward surge, possibly revisiting this year’s high of $0.02916, a level last witnessed on June 4.
Beam (BEAM) Price Prediction 2025
2025 Beam (BEAM) might experience a potential high of $0.038, driven by increased adoption and improved market sentiment following the 2024 Bitcoin halving. However, it could also see a low of $0.018 due to ongoing market corrections and potential regulatory challenges affecting privacy-focused cryptocurrencies.
Beam (BEAM) Price Prediction 2026
By 2026, Beam (BEAM) could face a potential low of $0.016 amid market corrections and reduced enthusiasm following the post-halving euphoria. Despite this, it might reach a high of $0.031 as innovations in Beam’s ecosystem attract more users and investors.
Beam (BEAM) Price Prediction 2027
In 2027, Beam (BEAM) may achieve a high of $0.044, driven by a market rebound as investors regain confidence after previous corrections. The price could also dip to $0.030 if broader economic challenges and regulatory pressures persist, impacting investor sentiment in privacy coins.
Beam (BEAM) Price Prediction 2028
Beam (BEAM) could hit a high of $0.070 in 2028, benefiting from the increased demand for privacy-focused cryptocurrencies and the effects of the 2028 Bitcoin halving. Conversely, the price might fall to $0.045 if technological challenges or competition from newer projects arise.
Beam (BEAM) Price Prediction 2029
In 2029, Beam (BEAM) could experience a high of $0.10 as the crypto market stabilizes and innovations within the Beam ecosystem continue to attract attention. A potential low of $0.062 may occur due to market consolidation and investor caution following the previous year’s gains.
Beam (BEAM) Price Prediction 2030
Beam (BEAM) may reach a high of $0.16 by 2030, supported by continued advancements and tactical joint efforts that bolster its ecosystem. However, if market conditions turn bearish or competition from other privacy platforms intensifies, the price might reach a low of $0.095.
Beam (BEAM) Price Prediction 2040
Looking ahead to 2040, Beam (BEAM) could soar to a high of $1.50, driven by widespread blockchain adoption and Beam’s robust technological developments. Conversely, it may also face a low of $0.89 if significant regulatory or technological hurdles emerge, challenging its growth trajectory.
FAQs
Beam is a privacy-focused blockchain that offers secure, cost-effective transactions and gaming possibilities through its advanced platform.
BEAM can be purchased directly from Binance using a debit or credit card. BEAM can also be traded for other cryptocurrencies on the Binance Exchange.
Beam has potential due to its privacy features and strong community support, but it carries market risks.
Beam’s all-time high is $0.04434, achieved on March 10, 2024.
Beam may reach $1 by 2040, with a projected high potential of $1.50.
Beam has a circulating supply of approximately 49,466,004,168 BEAM tokens.
Beam could surpass $0.04434 with a potential high of $0.070 in 2028.
Beam’s lowest price was $0.004241, recorded on October 29, 2023.
Alexander Zaidelson founded Beam.
Beam was launched in January 2019.
HODL Your Beam (BEAM) in Non-Custodial Wallets. Storing Beam (BEAM) in a non-custodial or self-custodial wallet grants you complete control over your private keys. You can use any type of wallet, including hardware wallets, Web3 wallets, or paper wallets.
In 2024, Beam’s price might range between $0.01482 and $0.02916.
2025 Beam’s price could range from $0.018 to $0.038.
In 2026, Beam might see prices between $0.016 and $0.031.
2027 Beam’s price could range from $0.030 to $0.044.
In 2028, Beam might see prices between $0.045 and $0.070.
2029 Beam’s price could range from $0.062 to $0.100.
In 2030, Beam might reach between $0.095 and $0.160.
2040 Beam’s price could range from $0.89 to $1.50.
Disclaimer: The information presented in this article is for informational and educational purposes only. The article does not constitute financial advice or advice of any kind. Coin Edition is not responsible for any losses incurred as a result of the utilization of content, products, or services mentioned. Readers are advised to exercise caution before taking any action related to the company.


