


 Eyes $300 as Bullish Divergence Appears")
- BNB tapped $280, as it outperformed the top four cryptocurrencies in the market.
- The OBV indicated a potential breakout that could trigger a 20% increase.
- If distribution wanes, BNB’s upward movement may be validated.
The price of Binance Coin (BNB) rose by 3.15% in the last 24 hours, and reached $280, CoinMarketCap data revealed. The performance made the coin the best-performing cryptocurrency out of the top 10 assets per market.
During the same period, Bitcoin (BTC), Ethereum (ETH), and Solana (SOL) had slight slides in price. The move comes as a positive development for BNB holders who have had to deal with losing the number 4 spot to Solana.
A Breakout Is Forthcoming
According to the BNB/USD 4-hour chart, volatility around the coin has been increasing. This inference was confirmed by the Bollinger Bands (BB). The BB also indicated the upper band had clipped the sharp candle that led BNB to $279.80.
This means that BNB was overbought, suggesting a reversal in the coin price. A look at the On Balance Volume (OBV) showed that the indicator was rising. The increase in the OBV suggests that accumulation is taking place — a warning that the coin may soon break out.
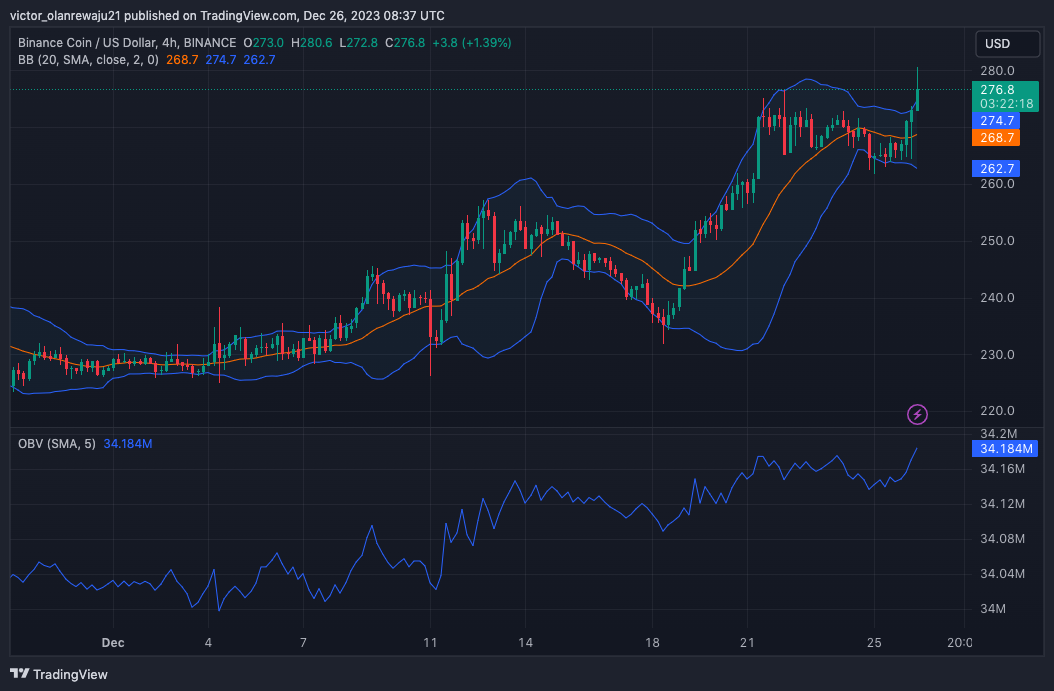
Should accumulation continue to increase, there is a chance that BNB may add another 20% increase and hit $300. However, traders may need to watch out for any sign of distribution. If distribution outweighs accumulation, the upward breakout may be invalidated.
BNB Bulls Have the Day
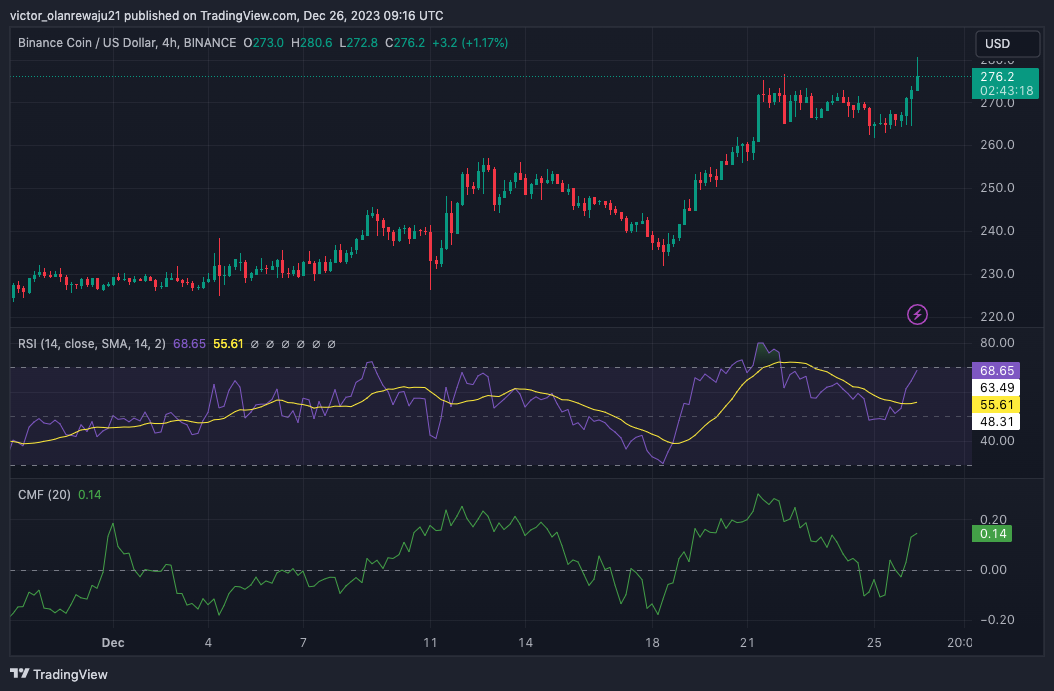
At press time, there has been a decline in the upward momentum as the price fell to $276.30. However, the Relative Strength Index (RSI) showed that the price decrease may not last long. At press time, the RSI was 68.65.
The RSI reading is a sign that buyers were in control. At the same time, market participants need to watch out if the RSI reaches or crosses above 70.00. Should this happen, then the coin price may decrease.
Furthermore, the Chaikin Money Flow (CMF) had increased to 0.14. The CMF measures buying and selling pressure within a given timeframe. The surge in the CMF also favors bulls, indicating a quicker money flow for a bullish divergence.
Going forward, BNB’s price may also follow the broader market increase. However, it might be challenging for the coin to take back its place from SOL.
This year, SOL has been one of the best performers in the market. So, it is unlikely for the cryptocurrency to halt its momentum. But as it stands, BNB might continue to hold on to its 5th position on the market cap standings.
Disclaimer: The information presented in this article is for informational and educational purposes only. The article does not constitute financial advice or advice of any kind. Coin Edition is not responsible for any losses incurred as a result of the utilization of content, products, or services mentioned. Readers are advised to exercise caution before taking any action related to the company.


