


 Non-Zero Addresses Have Reached An All-Time High")
- Multiple on-chain metrics for BTC have reached new all-time highs, according to Glassnode.
- CoinMarketCap indicated that BTC saw its price rise by 0.01% over the past 24 hours.
- Should BTC’s price close a daily candle above $29,600, then it may look to rise to $32,000 in the following week.
The market analytics platform, Glassnode Alerts, shared on Twitter earlier today that various on-chain metrics for the cryptocurrency market leader, Bitcoin (BTC), have reached new all-time highs (ATH). According to the post, BTC’s number of non-zero addresses has reached a new ATH for 48,039,035.
The previous non-zero addresses ATH of 48,038,925 was recorded on 12 August of this year. Additionally, Glassnode revealed in a separate tweet that BTC’s supply last active >10y just reached an ATH of 2,893,573,026 BTC. The previous ATH stood at 2,893,571,087 BTC and was also recorded on 12 August 2023 as well.
There has not been much movement in the cryptocurrency market heading into the end of the weekend, but CoinMarketCap indicated that BTC saw its price rise by 0.01% over the past 24 hours. This left the cryptocurrency king trading hands at $29,378.59 at press time.
Meanwhile, BTC’s 24 hour trading volume stood at $6,181,593,514, which was a 34+% drop since the previous day. The slight rise in BTC’s price over the past day resulted in its weekly performance remaining in the green zone at +1.20%. On the other hand, BTC was down by more than 6% over the past month.
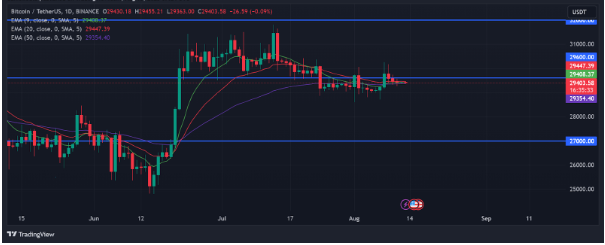
From a technical standpoint, the 9, 20 and 50 EMA lines on BTC’s daily chart were positioned at almost identical levels at press time. This suggested that traders and investors were waiting for a confirmation of which direction the cryptocurrency’s price would move in the coming week.
Should BTC’s price close a daily candle above $29,600, then it may look to rise to $32,000 in the following week. However, if it closes a daily candle below the 50-day EMA line at around $29,354.22, then it will most likely fall to $27,000 in the next few days.
Disclaimer: The views and opinions, as well as all the information shared in this price analysis, are published in good faith. Readers must do their own research and due diligence. Any action taken by the reader is strictly at their own risk. Coin Edition and its affiliates will not be held liable for any direct or indirect damage or loss.
Disclaimer: The information presented in this article is for informational and educational purposes only. The article does not constitute financial advice or advice of any kind. Coin Edition is not responsible for any losses incurred as a result of the utilization of content, products, or services mentioned. Readers are advised to exercise caution before taking any action related to the company.
: What Happens If You Use an Unlicensed Platform?")


