



- Bitcoin reclaimed $81,000 after dipping below $79,900, while Ethereum recovered toward $2,343.
- Ethereum failed to confirm Bitcoin’s latest liquidity sweep, signaling bearish SMT divergence.
- BTC faces resistance at $81,466, while ETH must clear $2,371 to strengthen its recovery.
Bitcoin and Ethereum rebound off the fourth-hour sell-offs; however, the recovery is not assured, with the charts signaling the opposite. Bitcoin reclaimed $81,000 after dipping below $79,900, while Ethereum climbed toward $2,343 after falling near $2,309. Notably, Ethereum has not confirmed Bitcoin’s latest liquidity sweep, creating a bearish Smart Money Technique (SMT) divergence as markets digest the Federal Reserve’s October 28 decision.
Bitcoin Reclaims $81,000 After Sharp Reversal
Bitcoin trades around $81,121 on the supplied chart after recovering from a steep red candle that pushed price toward $79,878. The rebound follows an earlier advance toward $81,600, where sellers reversed the move. This sequence shows active trading on both sides rather than a confirmed directional breakout.
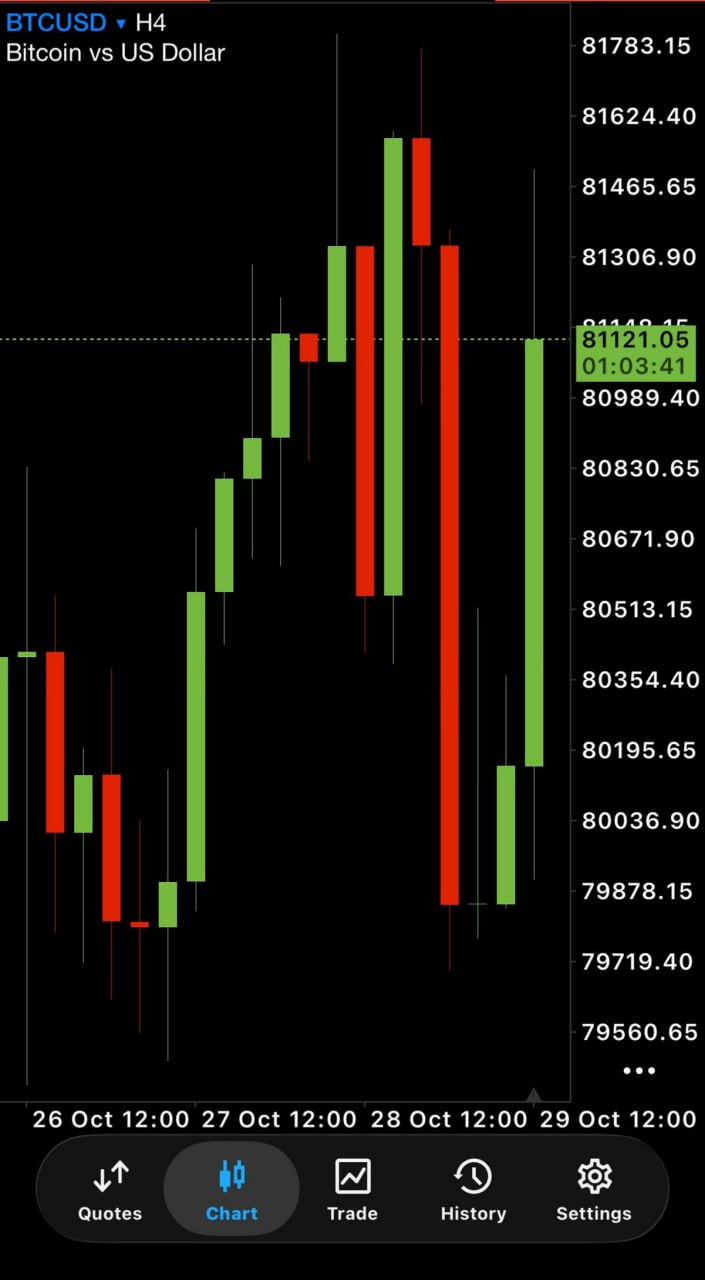
The immediate recovery has brought BTC back above $81,000, but the area around $81,306-$81,466 forms the next resistance zone based on recent candle levels. A sustained move above that band could open a retest of $81,624 and the earlier wick near $81,783. However, rejection below resistance would leave the rebound vulnerable to another test of $80,000 and the recent low around $79,878.
Ethereum Recovers but Fails to Match Bitcoin
Ethereum’s chart shows a similar sequence of rally, sharp reversal, and rebound. ETH climbed toward $2,371 before two strong bearish candles pushed it down near $2,309. The latest green candles have lifted the price to approximately $2,343, placing it above the immediate $2,325-$2,338 area.
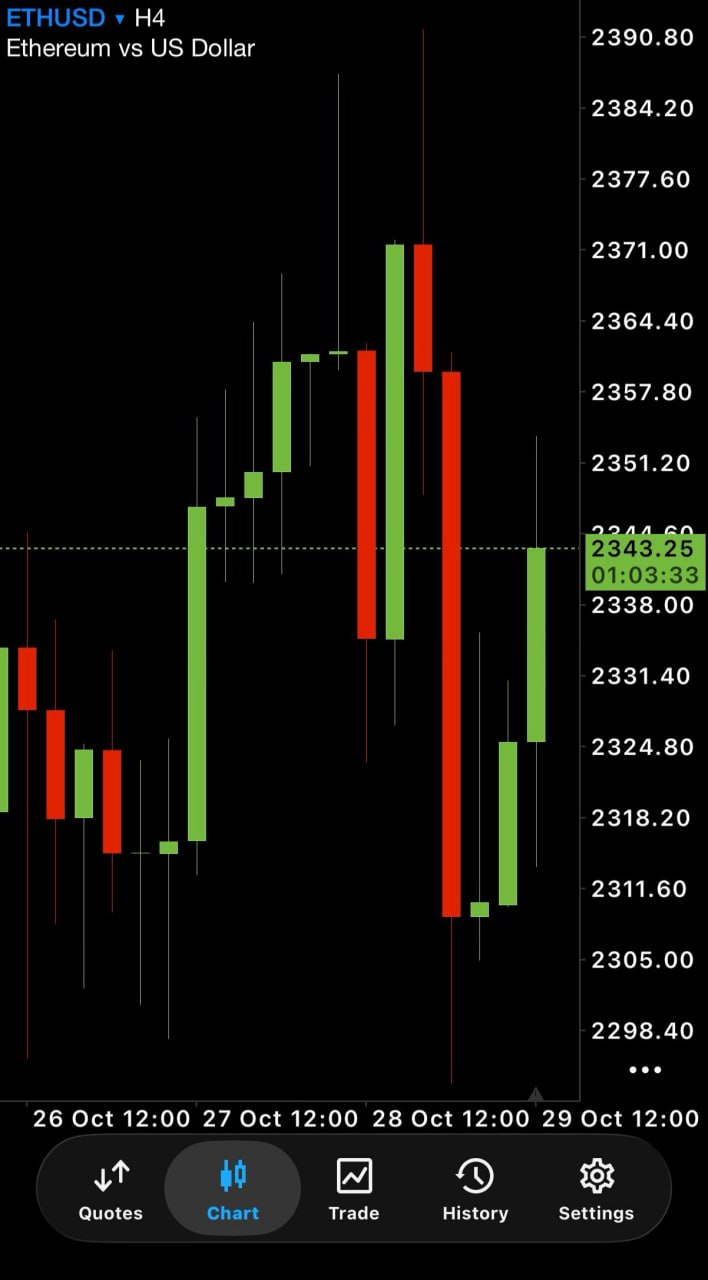
However, ETH remains below its recent high, with resistance around $2,351-$2,364 before the $2,371 peak. A break above these levels would strengthen the recovery structure. Conversely, a rejection could return attention to $2,325, followed by $2,309. The lower wick extends toward $2,298, making that region another downside reference if selling resumes.
Follow us on X for real-time crypto updates.
Bearish SMT Divergence Raises a Warning
Separately, TradingView analysis adds a relative-strength signal to this price action. Bitcoin swept buy-side liquidity above the previous day’s FOMC sell candle, while Ethereum failed to make a corresponding high. In technical analysis, this mismatch is known as bearish SMT divergence
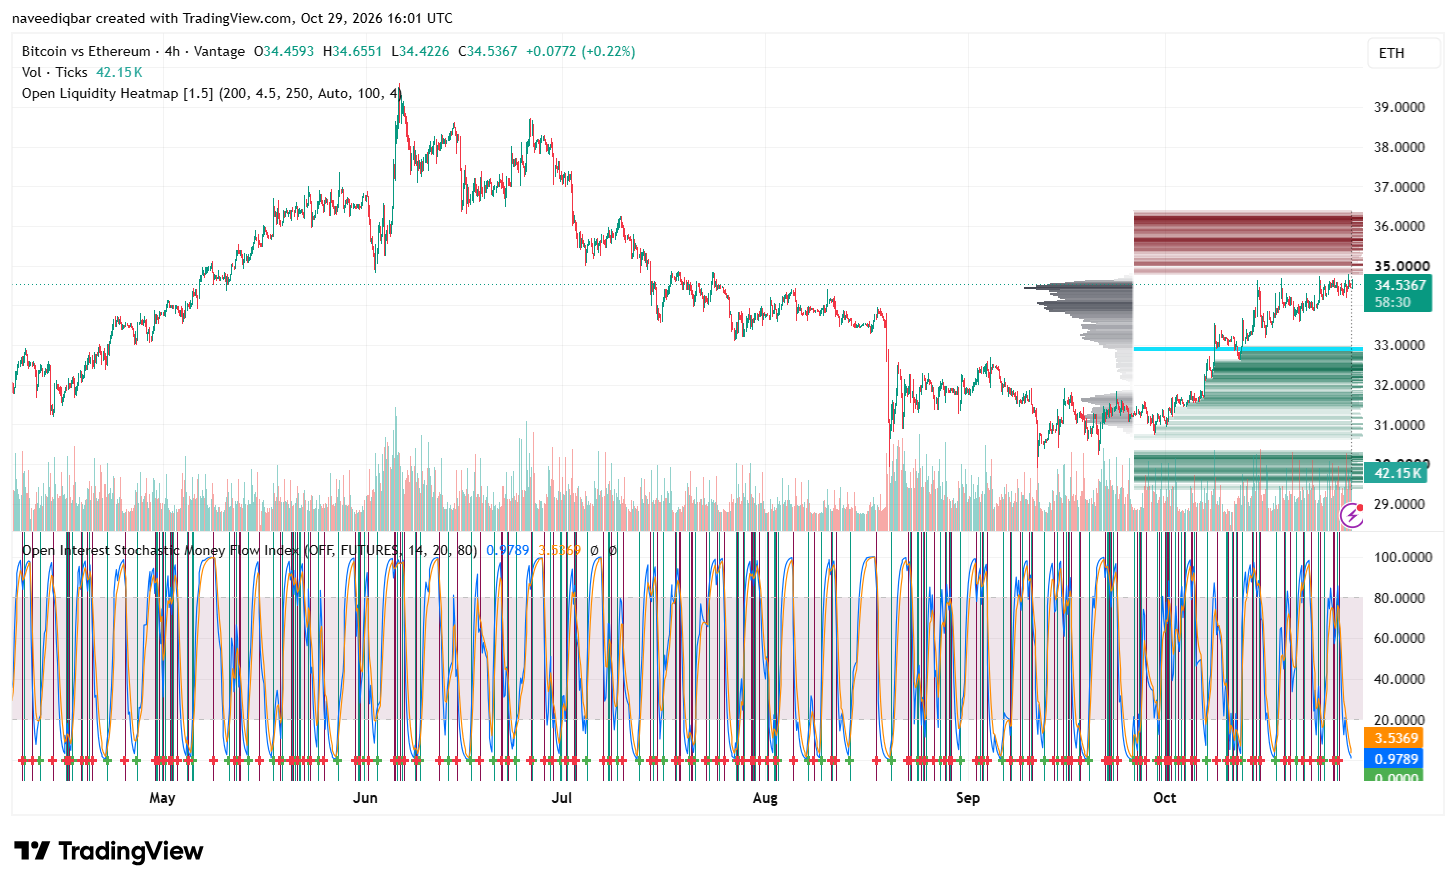
The signal suggests that Bitcoin’s push higher lacks confirmation across the two largest cryptocurrencies. It does not guarantee an immediate decline, but it gives traders a reason to watch whether BTC fails at resistance while ETH remains below its own recent peak. If both assets lose their latest rebound levels, the divergence would align with renewed downside pressure. A sustained BTC breakout accompanied by an ETH move above $2,371 would weaken this interpretation.
Fed Holds Rates as Inflation Remains Elevated
The Federal Reserve kept its target range at 3.75%–4.00% on October 28, but two officials voted for a quarter-point increase. The committee described economic activity as strong and said inflation remains elevated, leaving future policy dependent on incoming data. Investors can review the official FOMC statement.
The latest available US inflation report showed September CPI rising 3.7% year over year, while monthly inflation increased 0.6%, according to the Bureau of Labor Statistics. Persistent price pressures could limit expectations for easier monetary policy, potentially restricting liquidity-sensitive assets if yields and the dollar strengthen. However, the rate decision alone does not establish the cause of each chart move.
For traders, the immediate test is whether BTC can hold above $81,000 and ETH can remain above $2,325. The bearish interpretation would weaken if Bitcoin sustains a breakout above $81,783 while Ethereum clears $2,371, confirming strength across both assets rather than an isolated liquidity sweep.
Subscribe to our YouTube channel for the latest crypto news.
Related: Fed’s Cautious Stance Puts Bitcoin and Altcoins at Risk After Warsh’s Remarks
Disclaimer: The information presented in this article is for informational and educational purposes only. The article does not constitute financial advice or advice of any kind. Coin Edition is not responsible for any losses incurred as a result of the utilization of content, products, or services mentioned. Readers are advised to exercise caution before taking any action related to the company.