


- Bitcoin needs a clean break above $64K and $66K to weaken bearish pressure and confirm a reversal.
- Two separate models place Bitcoin’s next key support zones between approximately $52K and $59K.
- Historical data shows BTC rose in July 2018 and 2022 after recording negative June returns.
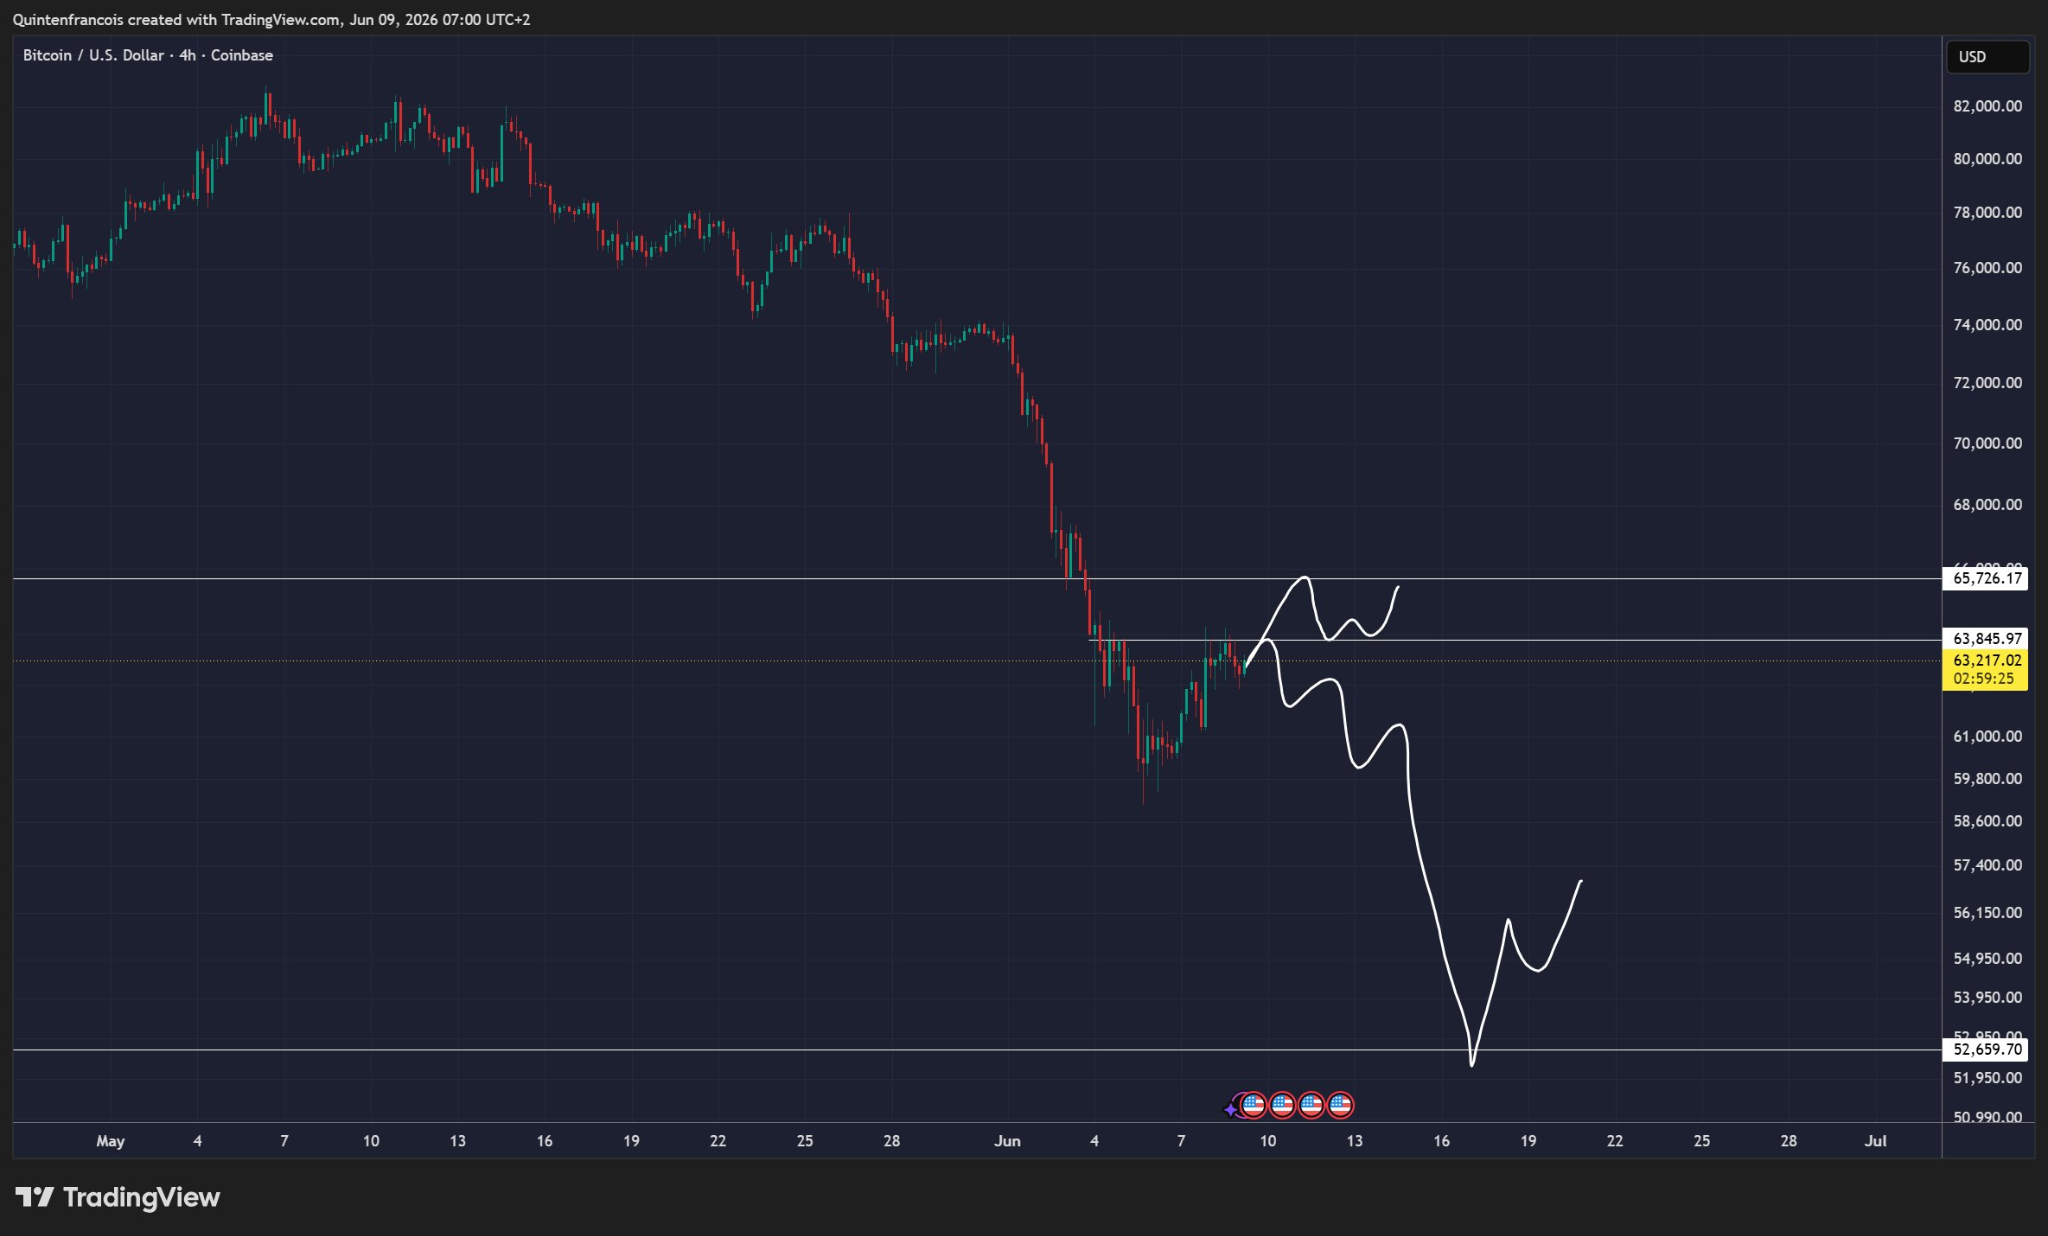
Bitcoin is approaching a decisive technical zone after its four-hour chart showed a rebound from below $60,000, stalling near $63,217. The recovery has returned the token price toward immediate resistance at $63,846, while the stronger confirmation area sits between $64,000 and $66,000.
Market analyst Quinten said short-term momentum remains bearish unless BTC clears those levels within several days. Failure to break above those levels in the coming days could send Bitcoin toward $52,660.
Bitcoin Faces a $64K–$66K Reversal Test
BTC remains below both reversal thresholds and only slightly under the chart’s first horizontal barrier. However, a clean move above $63,846 would test whether buyers can challenge the upper resistance near $65,726.
The wider structure still shows lower highs and lower lows following the decline from above $82,000. François said continued rejection could preserve bearish momentum and produce a temporary bottom near $52,000.
His downside path first passes through the $61,000 and $59,800 regions before extending toward $52,660. The chart presents these levels as conditional scenarios rather than confirmed price targets.
Red June History Offers a Limited July Comparison
On the same accord, CoinGlass data shows Bitcoin down 14% in June after losing 3.41% in May. The asset also fell 10.17% in January and 14.94% in February, while March and April returned 1.81% and 11.87%.
Market analyst TraderPA compared the current setup with earlier midterm election years. In the two displayed cases featuring a red June, BTC lost 14.62% in 2018 and 37.28% in 2022, followed by a green July, 20.96% in 2018 and 16.8% in 2022.
“Historically, Bitcoin prints a green July in midterm years after a red June. A red June close is almost inevitable at this point,” TraderPA said in an X post.
TraderPA further expects trading conditions to remain uneven during the rest of June. However, the analyst said he is positioning for a relief rally while many market participants prepare for further declines.
CVDD Model Identifies a $52K–$59K Bitcoin Bottom Zone
From an on-chain perspective, Glassnode co-founder Rafael said BTC’s CVDD-to-price ratio has climbed to 0.73, moving closer to readings seen near previous cycle bottoms. Initially, the ratio reached about 0.90 in 2015, 0.91 in 2018, and 0.95 in 2022.
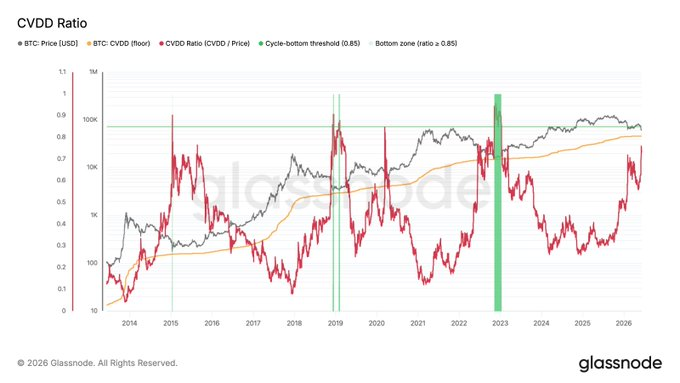
Using those historical levels, Rafael placed Bitcoin’s potential bottom between $52,000 and $59,000. His calculation is based on the current CVDD floor near $46,000 and how closely BTC’s price approached that floor during earlier downturns. That range overlaps the $52,660 technical support mark on François’ chart.
The two approaches, therefore, identify a similar lower region through different methods. However, both remain conditional while Bitcoin trades below the $64,000–$66,000 resistance band.
Related: Bitcoin’s World Cup Curse: 2014, 2018, 2022 – Is 2026 Next?
Disclaimer: The information presented in this article is for informational and educational purposes only. The article does not constitute financial advice or advice of any kind. Coin Edition is not responsible for any losses incurred as a result of the utilization of content, products, or services mentioned. Readers are advised to exercise caution before taking any action related to the company.
 Price Prediction 2026, 2027, 2028, 2029, 2030 -2050")


